
How to Read Candlestick Charts? The Core Logic of Price Action
Many novice traders dive headfirst into complex technical indicators like MACD and RSI, yet overlook the most fundamental and core tool: the candlestick. Indicators are derived from price, and price is ultimately presented through candlesticks.
The essence of price action is the final trace of the emotions and capital battles among all market participants. Every single candlestick tells a story: greed and fear, offense and defense. Understanding the meaning of individual candlesticks, the implications of candlestick patterns, and their position within the overall trend structure is the foundational logic for building any trading system. Skip this step, and all technical analysis becomes a castle in the air.
A leading global cryptocurrency platform,suitable for both beginners and experienced traders.
New user benefit: 20% off trading fees upon registration!!
1. Candlestick Structure: Every Detail Has Meaning
Candlesticks are far more than just red and green bars; each part reveals key market information.
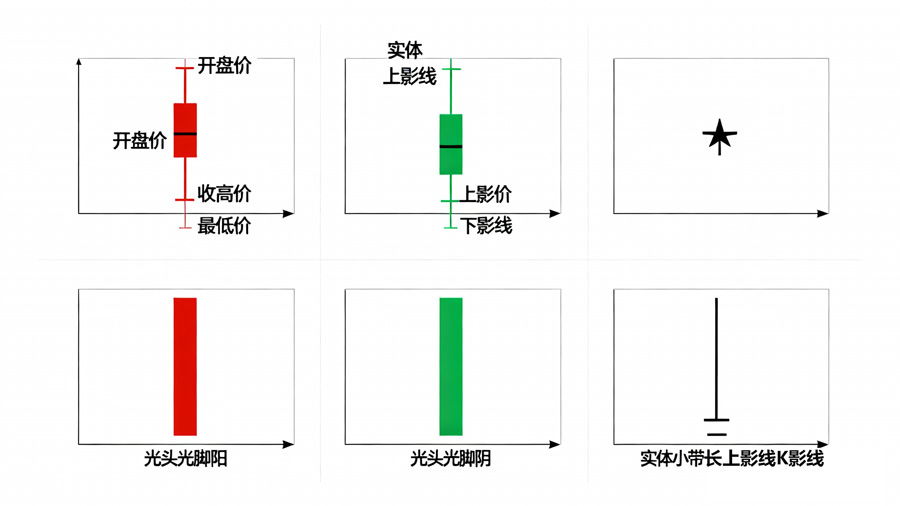
The Four Core Prices of a Candlestick
- Open: The starting point of battle for a time period.
- Close: The final result of the battle for a time period; this is the most important of the four prices.
- High/Low: Represents the extremes reached by both bullish and bearish forces within that period.
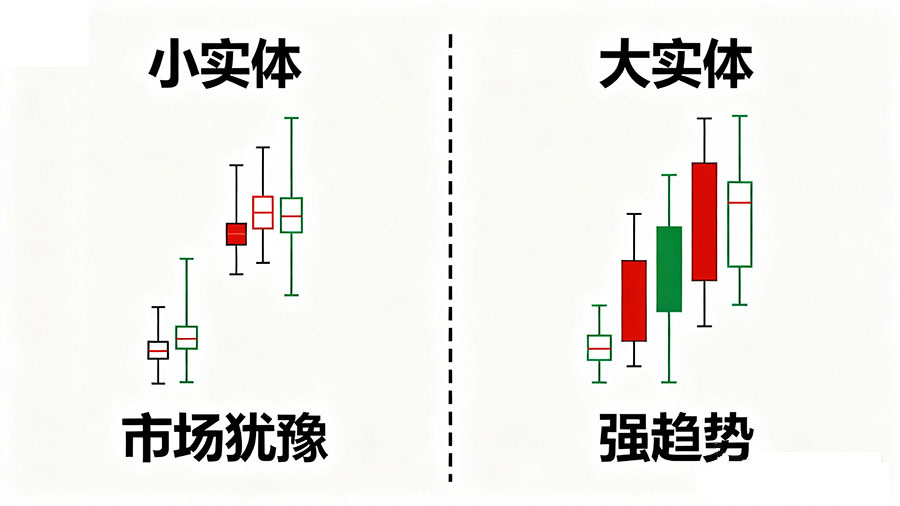
What Does the Real Body Represent?
The real body is the area between the open and close, representing the direct outcome of the battle between bulls and bears.
- Large Real Body: Indicates one side holds absolute dominance, with a strong trend.
- Small Real Body: Indicates a stalemate between bulls and bears, with market indecision.
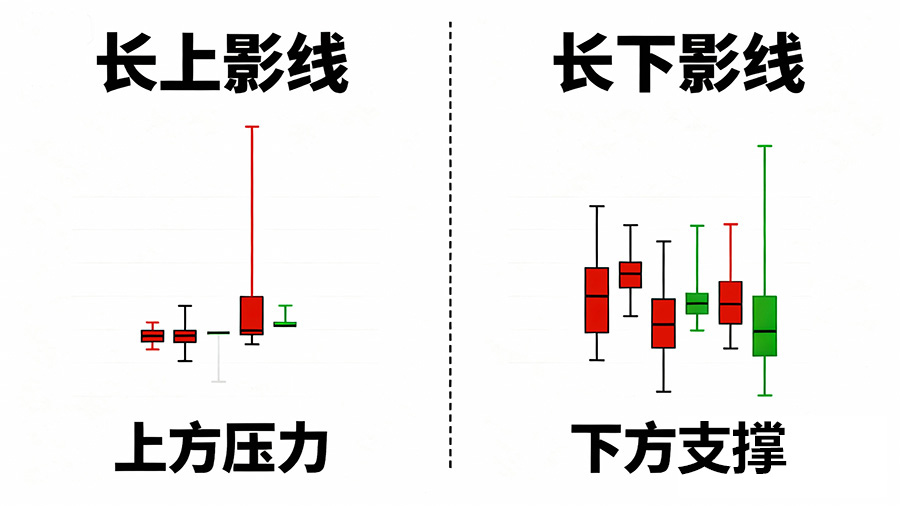
What Do the Wicks/Shadows Represent?
- Upper Wick: Shows that bulls attempted to push the price higher but faced strong bearish resistance, causing the price to fall from the high. Can be interpreted as "bulls being suppressed" or "bears testing resistance."
- Lower Wick: Shows that bears attempted to push the price lower but faced strong bullish absorption, causing the price to bounce from the low. Can be interpreted as "bears being absorbed" or "bulls testing support."
- Long Wick: Especially important, often signaling a strong reversal sentiment or accumulation/distribution by large players.
Color doesn't represent "up or down," but an emotional node
Green (down) or red (up) itself isn't important; what matters is the position of the current candlestick relative to the previous one. A green candlestick with a long lower wick might signify weakening downward momentum, and its bullish implication could be stronger than a small-bodied red candlestick.
A leading global cryptocurrency platform,suitable for both beginners and experienced traders.
New user benefit: 20% off trading fees upon registration!!
2. Core Logic of Price Action: Why "Candlestick ≠ Pattern," but "Action"
When learning candlesticks, avoid memorizing patterns mechanically. You need to understand the underlying market action logic.
Market Action = Emotion + Liquidity. Candlesticks are the visual result of the battle between these two factors.
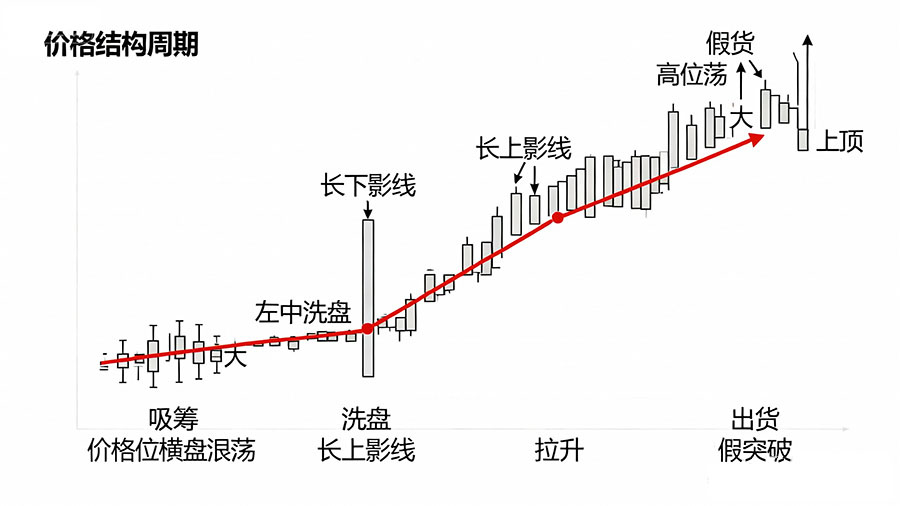
The behavior of large players leaves traces on candlesticks:
- Accumulation: Usually at the bottom, accompanied by long lower wicks and small real bodies, with narrowing volatility.
- Washout: Uses rapid declines (large bearish candles) to create panic and shake out retail traders.
- Distribution: At the top, accompanied by long upper wicks and huge volume, appearing unable to break higher.
Key Insight: The same candlestick has completely different meanings on different timeframes. A "hammer" on the daily chart could be a strong reversal signal, while a "hammer" on the 1-minute chart might just be market noise. It must be understood in the context of the higher timeframe trend.
3. Six Most Important Single Candlestick Patterns
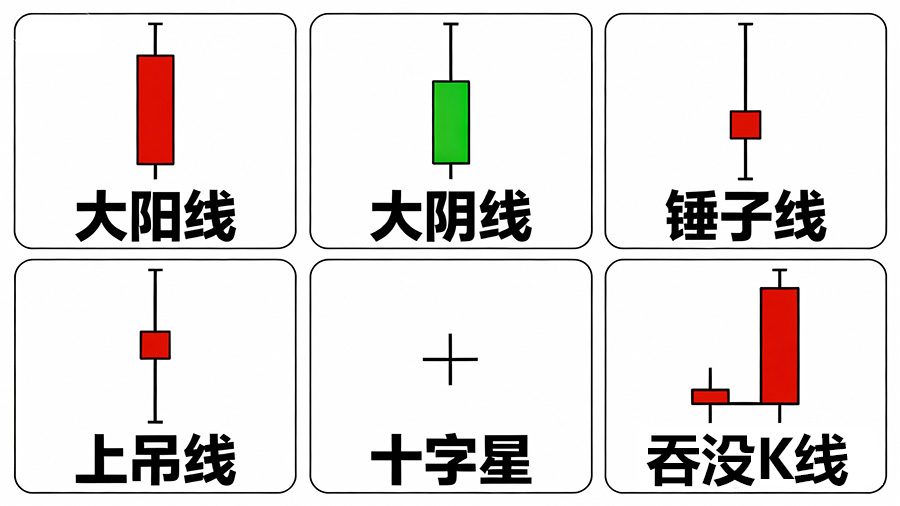
Understand from action logic, not shape memory:
- Large Bullish Candle: Strong breakout, dominant bulls. Shows buyers controlled the situation from open to close.
- Large Bearish Candle: Strong breakdown, dominant bears. Shows sellers are powerful with no resistance.
- Hammer: Strong buying absorbs selling pressure. Appears in a downtrend; the long lower wick indicates bears failed to push down, and bulls are starting to fight back.
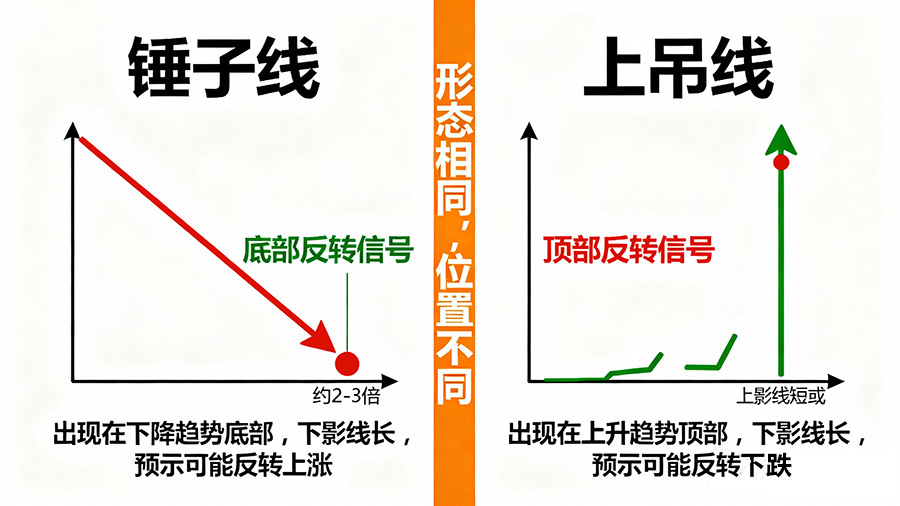
- Hanging Man: Heavy selling pressure above. Appears in an uptrend; the long lower wick shows bulls lack strength to push up, and bears are starting to counterattack.
- Doji: Stalemate between bulls and bears; trend enters a waiting period. Shows market indecision; the next direction needs confirmation from subsequent candles.
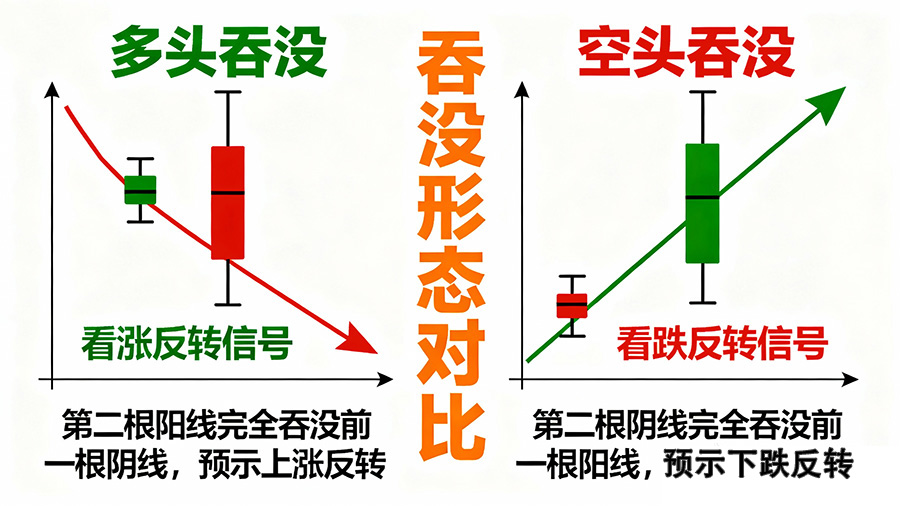
- Engulfing Candle: Extreme emotional reversal. The real body of the subsequent candle completely covers the previous one, indicating the old trend is strongly suppressed and reversed by new forces.
A leading global cryptocurrency platform,suitable for both beginners and experienced traders.
New user benefit: 20% off trading fees upon registration!!
4. Three Classic Candlestick Combination Patterns
Combination patterns are more reliable than single candlesticks.
1. Bullish Engulfing / Bearish Engulfing
Powerful reversal signal. Only effective when appearing at the end of a clear trend; less meaningful in a range.
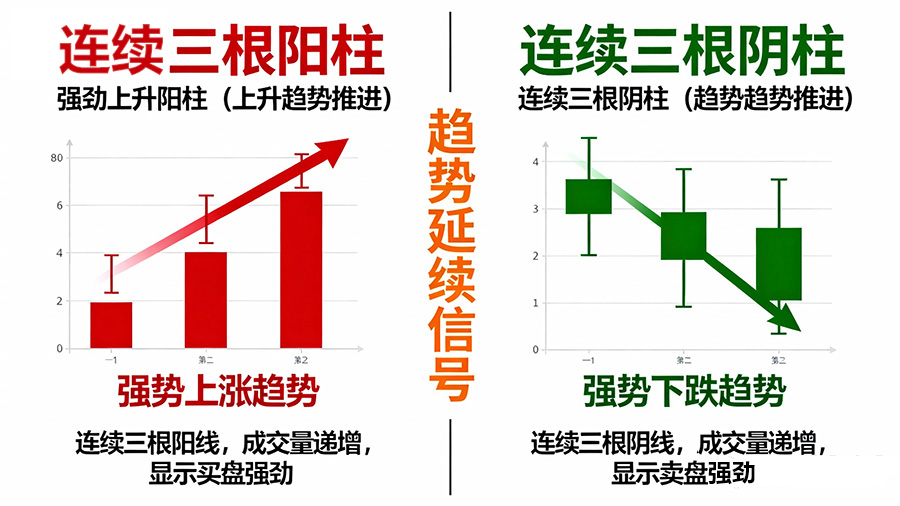
2. Three White Soldiers / Three Black Crows
Confirmation signal of trend continuation. Indicates sentiment is aligning and the trend is accelerating.
3. Morning Star / Evening Star
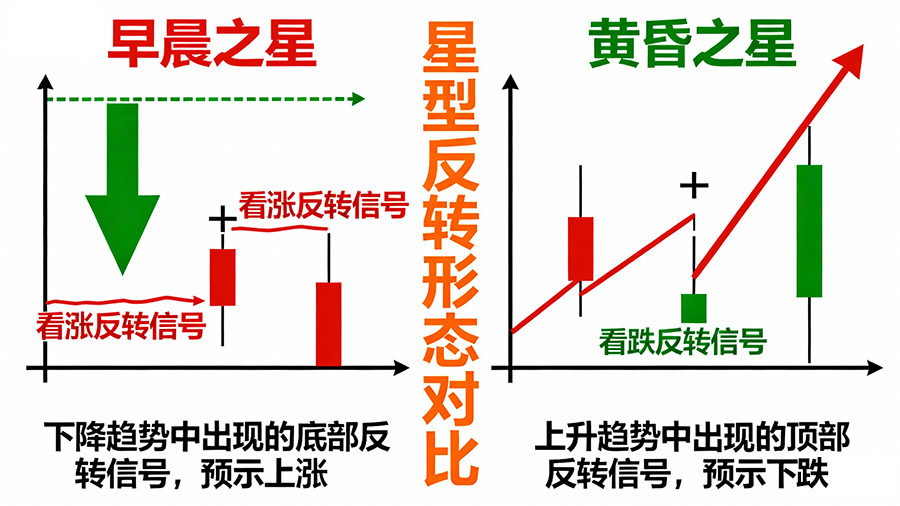
Composed of three candles, it is a reversal pattern with a high probability of marking a temporary bottom or top.
5. Structure Over Pattern: Candlesticks Must Be Understood with the Trend
The effectiveness of a pattern depends on its location.
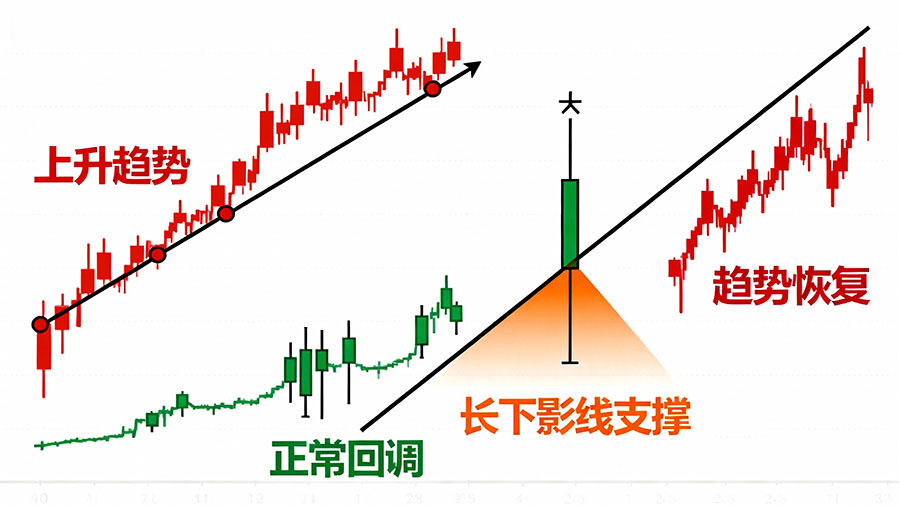
In an Uptrend:
A candlestick with a long lower wick appearing during a pullback is an excellent signal to buy the dip.
"Small-bodied consecutive bullish candles" in a strong trend indicate steady upward progress without needing a pullback.
In a Downtrend:
A candlestick with a long upper wick appearing during a bounce is an opportunity to sell the rally.
During trend acceleration with large bearish candles, do not try to catch the falling knife.
In a Range:
Long wicks are very common here, and trend significance is weakened.
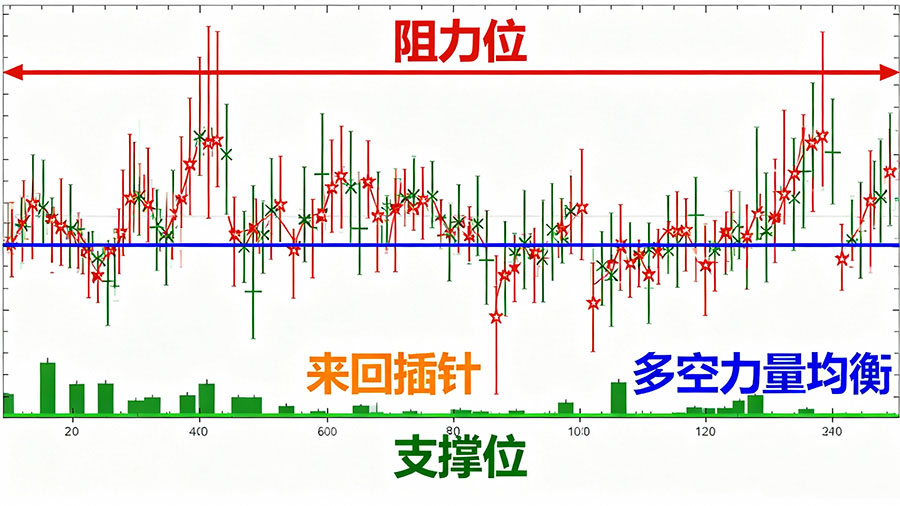
Focus on observing the aggressiveness of candlesticks at the "range high and low" (e.g., whether a large bullish candle breaks out or a large bearish candle breaks down).
A leading global cryptocurrency platform,suitable for both beginners and experienced traders.
New user benefit: 20% off trading fees upon registration!!
6. Price-Volume Relationship: Candlesticks Are Meaningless Without Volume
Volume is the "lie detector" for candlesticks.
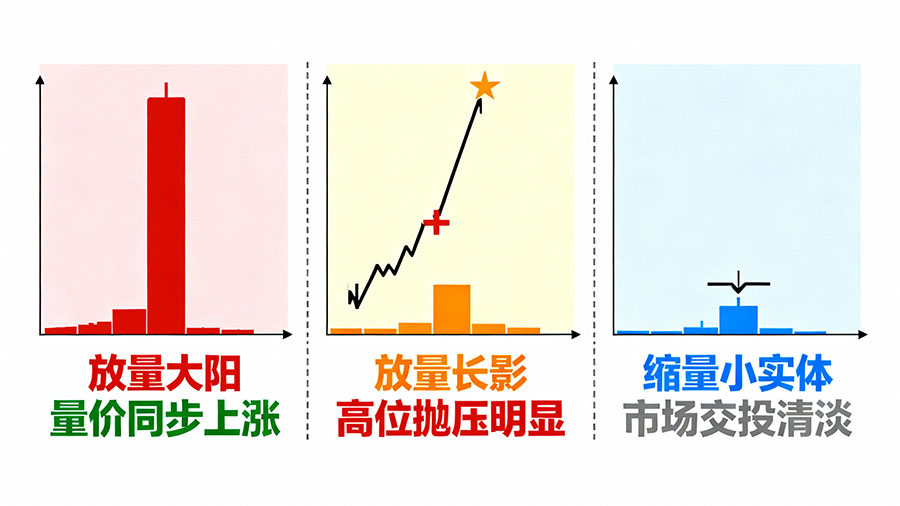
- High Volume + Strong Candlestick: Trend confirmed by capital, highest reliability.
- High Volume + Long Wick: Intense battle between bulls and bears, outcome unclear, proceed with caution.
- Low Volume + Small Body: Market lacks participation, strong wait-and-see sentiment, no trading value.
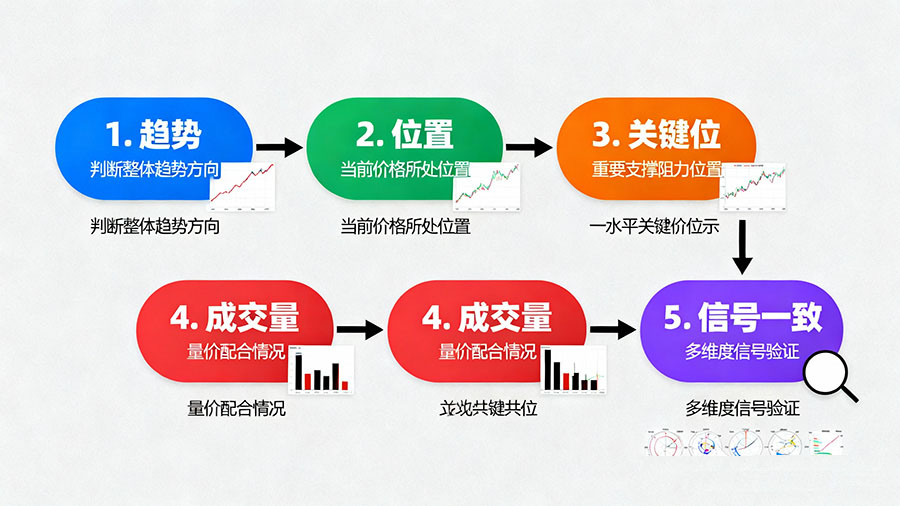
7. Practical Method for Reading Candlesticks
A set of actionable steps:
Step 1: Look at the big trend first – is it up, down, or ranging?
Step 2: Identify the current stage – is the current candlestick at the beginning, middle, or end of the trend?
Step 3: Identify key levels – is it near a significant support or resistance level?
Step 4: Incorporate volume – is the current price-volume relationship healthy?
Step 5: Wait for signal alignment – the best time to act is when the "candlestick pattern," "trend structure," and "key level" all signal in the same direction.
8. Common Mistakes
Memorizing shapes, ignoring location: A "hammer" appearing in the middle of a trend versus at its end has vastly different meanings.
Forcing trend patterns in a range: Most "breakout" signals in a ranging market are false signals.
Treating a single candlestick as a "major reversal": Any single signal needs confirmation from subsequent candlesticks.
Ignoring volume leads to distorted judgment: A candlestick pattern without volume confirmation is like a performance without an audience; it could be a "fake move."
Viewing small timeframe candlesticks as the larger trend: This is one of the main reasons beginners lose money.
A leading global cryptocurrency platform,suitable for both beginners and experienced traders.
New user benefit: 20% off trading fees upon registration!!
9. FAQ
Q1: What should a beginner look at first?
A: Follow the priority of "Trend > Location > Candlestick Pattern." Judge the big picture first, then look for details.
Q2: Are candlestick patterns reliable?
A: Patterns themselves are just a probability game. The "location where they appear" determines their reliability. A reversal pattern appearing at a key support/resistance level is far more reliable than the same pattern appearing at a random point.
Q3: Do lots of wicks mean manipulation?
A: Not necessarily. Within a range, many wicks are normal. The key is whether the price can eventually break out of these wick-filled areas to form a new trend.
Q4: Can candlesticks be used alone for decisions?
A: Absolutely not. Candlesticks must be combined with volume and trend structure to form a complete chain of evidence before being used as a basis for decision-making.
Further Reading
To systematically improve your trading skills, we recommend continuing with:
How to Read Trading Volume: Techniques for Judging Volume Expansion, Contraction, and Trend Strength
How to Confirm a Trend Reversal: Three Essential Structural Signals for Beginners
How to Read Multiple Timeframes: The Sandwich Rule for Beginners
