
How to Read Trading Volume? Tips for Judging Volume Expansion, Contraction, and Trend Strength
When you only focus on the ups and downs of price, you might only be seeing half the market story. The other half is often hidden in trading volume, which reveals the true capital intentions behind price movements.
1. Why is "Volume" the Most Honest Indicator?
Among the many technical indicators, trading volume is arguably the "most honest indicator." Price can be briefly manipulated by a small amount of large capital, creating tempting traps, but trading volume—the record of real money transactions—is extremely difficult to fake on a large scale over the long term. It directly reflects market participation and the level of commitment from both buyers and sellers.
A leading global cryptocurrency platform,suitable for both beginners and experienced traders.
New user benefit: 20% off trading fees upon registration!!
Simply put, high volume usually signals the "true intention" of a trend, with many traders agreeing on the current direction. Conversely, low volume may indicate trend exhaustion or a market in a hesitant consolidation phase. If you want to truly understand trend strength and distinguish the real meaning behind high and low volume, trading volume is the core indicator you need to prioritize learning.
2. Basic Concepts of Trading Volume (Must-Know for Beginners)
Trading volume, within a specific timeframe (e.g., 1 hour, 1 day), refers to the number of tokens traded or the monetary value of the trades. Below the candlestick chart, it's usually displayed as vertical bars, which we call "volume bars."
- High Volume: When the current volume bar is significantly higher than the average volume bar level of the recent period, indicating active market trading, increased divergence, or strengthened consensus.
- Low Volume: When the current volume bar is significantly lower than the average volume bar level of the recent period, indicating quiet market trading and a strong wait-and-see attitude among participants.
Ultimately, all judgments about trend health come back to one point—"price-volume relationship" is the true foundation of technical analysis. Price tells you what happened (up or down), while volume tells you the strength of the move (strong or weak). Only by combining the two can you make an accurate diagnosis of the market trend's health.
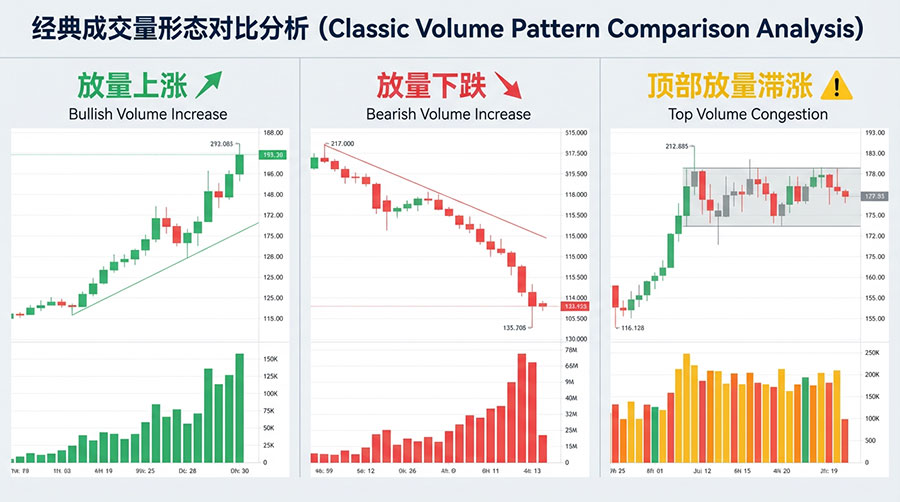
3. Three Typical Scenarios of High Volume
1. High Volume Upward: Trend Strengthening Signal
Characteristics: A bullish candlestick with a long real body (long green/white candle), accompanied by a significant increase in the volume bar below.
Market Interpretation: This indicates that the upward move is recognized and chased by substantial capital, with strong and proactive buying pressure. This is a strong signal that the trend may continue, especially when breaking through key resistance levels.
Beginner Mistake: Easily misjudging an "emotional surge" triggered by sudden positive news as the start of a trend, resulting in buying at the top. The key is to observe whether this "high volume upward move" is sustainable. Only a sustained high-volume breakout represents a true trend, not an emotional spike.
2. High Volume Downward: Trend Breakdown Signal
Characteristics: A bearish candlestick with a long real body, accompanied by a sharp increase in trading volume.
Market Interpretation: This indicates immense selling pressure, with a flood of panic selling and stop-loss orders, showing bears are in complete control. If this occurs at a key support level, it usually means the support has been effectively broken, and the downtrend may accelerate.
How to distinguish a real breakdown from a fake one: A real breakdown is usually accompanied by sustained high volume and weak bounces; a fake breakdown might involve a sudden burst of volume followed by a quick recovery, with volume unable to sustain.
3. High Volume at the Top: Distribution Signal
Characteristics: After a significant price increase, "high volume stagnation" appears at a high level—meaning volume is huge, but the price cannot continue to rise substantially, often with candlesticks featuring long upper shadows.
Market Interpretation: This is one of the most dangerous signals. It usually means major players are using market euphoria to distribute (sell) their holdings. "High volume without price increase" at the top is often more dangerous than a high-volume decline because it is highly deceptive, leading investors to believe it's just a handover for continued upward movement.
How to avoid catching the falling knife: After a significant price rally, if you see high volume but the price can't go higher, be highly vigilant and consider reducing positions rather than buying.
4. Three Typical Scenarios of Low Volume
1. Low Volume Upward: Weakening Upward Momentum
Market Interpretation: In an uptrend, if trading volume starts to shrink gradually, failing to keep pace with the price advance, it means the upward momentum is waning. This indicates fewer buyers are chasing higher prices, and bullish strength is insufficient. The trend may enter a consolidation or correction phase.
Distinguishing healthy pullbacks from trend exhaustion: Healthy pullbacks usually show insignificant volume shrinkage and find support at key levels; trend exhaustion is characterized by a sustained low-volume rise, making the price vulnerable to a sharp drop.
2. Low Volume Downward: Weakening Bearish Momentum
Market Interpretation: In a downtrend, trading volume gradually shrinks. This indicates fewer sellers are willing to cut losses at lower prices, and bearish strength is exhausting. This is often a common characteristic of the market approaching a bottom area.
Note: A low-volume decline does not mean an immediate reversal; it only indicates reduced selling pressure, and the market may be entering a bottoming phase.
3. Low Volume Consolidation: Trend Accumulation Phase
Market Interpretation: Price oscillates narrowly within a range while volume remains persistently low. This indicates a temporary balance between buyers and sellers, with the market accumulating energy. Low volume here is healthy, preparing for the next directional move.
Trading Tip: Once a low-volume consolidation is broken with high volume (up or down), it often signals the start of a new trend and is an important entry signal.
A leading global cryptocurrency platform,suitable for both beginners and experienced traders.
New user benefit: 20% off trading fees upon registration!!
5. Trend Judgment: Three Classic "Price-Volume Combination" Models
In actual trading, 90% of trend strength judgments can be summarized into the following three classic price-volume combinations.
- Volume Up, Price Up: The healthiest bullish pattern. It represents an uptrend continuously driven by capital inflow, making the trend solid. For example, a breakout above a previous major high must be accompanied by high volume to be a valid true breakout.
- Volume Down, Price Up: A dangerous signal of weakening upward momentum. It means only the price is rising, but without sufficient capital following through, likely a bull trap. Common in late-stage bull markets or the end of a rebound.
- Volume Down, Price Down: A bottoming signal of weakening bearish momentum. It represents exhausted downward momentum. Although the price is still declining slowly, no one is willing to sell at a loss. Common during market bottom-building phases, signaling a time to wait for a reversal signal.
6. Differences in High and Low Volume Across Timeframes
The larger the timeframe, the more reliable the volume signal. A high-volume breakout on the daily chart is far more significant than one on the 5-minute chart.
Why are there more false signals on smaller timeframes? On smaller timeframes like 15-minute or 5-minute charts, a single large trade can create a non-trending high-volume false breakout, making it more misleading.
Advice for Beginners: Set your primary judgment timeframe to 4-hour or daily charts. Use the price-volume relationship on larger timeframes to determine the direction, then use signals from smaller timeframes to find precise entry points.
7. Practical Example: BTC Breaking Key Resistance
Let's use a typical BTC rally as an example:
Background: After a period of consolidation, BTC approaches a significant resistance level.
Step 1: High Volume Breakout: One day, BTC forms a bullish candlestick, breaking strongly above the resistance level. Simultaneously, the volume below increases significantly, forming a healthy "volume up, price up" pattern. This is a positive entry signal.
Step 2: Low Volume Pullback: After the breakout, the price doesn't skyrocket immediately but pulls back slightly to test the former resistance level (now turned support). Crucially, this pullback occurs on noticeably low volume, indicating low selling pressure and holders unwilling to sell.
Step 3: High Volume Confirmation Again: After finding support at the support level, the price rallies again, accompanied by a moderate increase in volume, confirming the validity of the uptrend.
This pattern of "High Volume Breakout → Low Volume Pullback → High Volume Re-Entry" is one of the most classic and reliable models in trend trading.
This model is reliable because it perfectly embodies the standard logic for identifying trend strength: "High Volume Confirmation → Low Volume Pullback → High Volume Re-Validation."
A leading global cryptocurrency platform,suitable for both beginners and experienced traders.
New user benefit: 20% off trading fees upon registration!!
8. Common Mistakes (Beginners Must Avoid)
Mistake 1: Only looking at the size of the volume, ignoring the price's position. The meaning of high volume at the top is completely opposite to high volume at the bottom.
Mistake 2: Mistaking "volume expansion after a sharp rally or crash" as the start of a trend. This is often a normal phenomenon of volatility returning, not a directional choice.
Mistake 3: Believing all high-volume declines are "panic selling" meaning a rebound is imminent. In reality, a high-volume decline is more likely the beginning of trend acceleration.
Mistake 4: Relying on a single volume bar to judge a trend. Volume analysis must look at the pattern and trend of a group of volume bars; a single bar can be highly misleading.
Mistake 5: Ignoring price-volume divergence signals. When price makes a new high but volume doesn't increase correspondingly, it's a classic top warning; when price breaks to a new low but volume doesn't expand, it could be a fake breakdown or exhaustion of the decline.
9. Summary
High volume represents the authenticity of the market direction and the consensus of capital; low volume reveals the weakening of market power or temporary strategic consolidation. A mature trader never separates price from volume. True trend analysis must be a comprehensive judgment integrating "Volume, Price, and Structure." Therefore, whether you are a scalper or a swing trader, you must incorporate "Trading Volume, High Volume, Low Volume" into your analysis system to truly understand the capital logic behind the trend.
10. FAQ
Q1: How to determine what counts as high volume?
A: There is no absolute standard. It's usually compared to the average level of recent (e.g., 20-30) volume bars. Significantly higher than this average is considered high volume.
Q2: Does high volume always mean the trend will continue?
A: Not necessarily. The key is the position. In the early and middle stages of a trend, high volume suggests continuation; in the late stage of a trend, high volume (especially stagnation with high volume) is more likely to signal a reversal.
Q3: Does a low-volume decline mean the bottom is in?
A: A low-volume decline is a necessary but not sufficient condition for a bottom. It means bearish momentum is exhausted, but it doesn't mean bulls will immediately counterattack. Confirmation of a bottom requires a reversal signal in the price structure (e.g., bullish engulfing, double bottom).
Q4: What if volume signals conflict across multiple timeframes?
A: Follow the principle: "Use larger timeframes for direction, smaller timeframes for entry." For example, use the daily chart to judge trend strength, the 4-hour chart for structure, and the 15-minute chart to find specific entry points.
Further Reading
"How to Confirm a Trend Reversal? Three Essential Structure Signals for Beginners"
"How to Identify Fake Breakouts? Three Common Traps Set by Market Makers"
"How to Read Candlestick Charts? The Core Logic of Price Action"
