
How to Confirm Trend Reversal? 3 Key Structure Signals Beginners Must Learn
Seeing a big green candle and rushing to buy long, only to end up buying at the waist of the move; witnessing a sudden crash and panic selling, only to sell at the very bottom. This is perhaps a shared experience for all novice traders. The key to solving this problem lies in understanding the true logic of trend reversals.
A leading global cryptocurrency platform,suitable for both beginners and experienced traders.
New user benefit: 20% off trading fees upon registration!!
1. Why is judging trend reversals the easiest pitfall for beginners?
The most expensive illusion in the market is mistaking a common bounce for a trend reversal. This "reversal illusion" causes beginners to repeatedly "catch falling knives mid-air," ultimately depleting their capital.
The core issue is that most beginners rely on emotions and single candlesticks to judge market turns. A single big green candle can ignite boundless bullish enthusiasm, while a single big red candle is enough to trigger complete panic. However, a true trend reversal is never an instantaneous change. It is usually driven by a combination of capital flow and changes in market structure, a gradual process.
This article will reveal the essence of trend reversals and teach you three core signals based on market structure. You will learn to trade not with "feelings," but with "structure" to identify the market's true intentions.
2. The Essence of Trend Reversal: Structure Breakdown + Momentum Decay + Liquidity Shift
The market does not reverse without reason. Behind a trend that has lasted for weeks or even months lies a stable balance of bullish and bearish forces. A reversal can only occur when this balance is broken.
1. Why does a market trend need a "structure breakdown" to reverse?
An effective break of the original price trajectory (e.g., an ascending or descending channel) means the momentum sustaining the old trend has shown its first crack.
2. Why is momentum decay a core signal before a reversal?
In an uptrend, each new high appears weak; in a downtrend, each new low shows diminishing momentum. This indicates the force driving the trend is exhausting.
Liquidity Shift: Smart money begins to position quietly, buying when no one is interested and distributing when the crowd is euphoric, completing a transfer of liquidity that dictates market direction.
For beginners, it's crucial to understand: a trend change is a chain reaction of "Structure → Price → Sentiment". The purpose of our technical analysis is to detect clues at the "structure" level, long before market sentiment catches up.
A leading global cryptocurrency platform,suitable for both beginners and experienced traders.
New user benefit: 20% off trading fees upon registration!!
3. Three Essential Reversal Structure Signals for Beginners
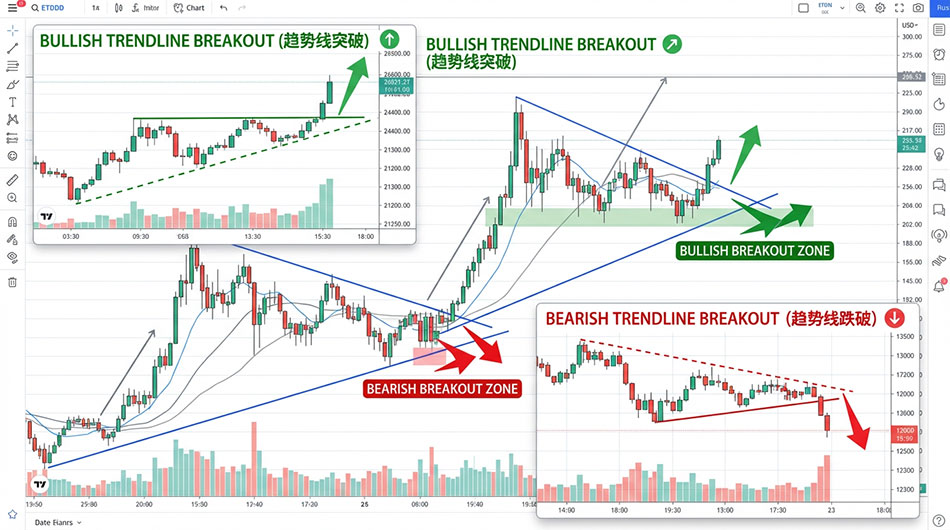
1. Structure Signal 1: Effective Break of Trendline/Channel (Structure Breakdown)
This is the initial alarm for a trend reversal, signaling that the existing order may be breaking down.
Conditions for Occurrence & Practical Interpretation:
Confirming the Trendline: An effective trendline needs at least three points (two points to draw the line, a third to confirm its validity) for confirmation.
Effective Break: When price touches the trendline for the fourth time and breaks through strongly (candle body closes completely beyond the line), it is considered an initial signal. This breakout must be accompanied by a significant increase in volume; otherwise, it is highly likely a false breakout.
Application:
Uptrend: Price effectively breaks below the uptrend line, suggesting upward momentum may have ended.
Downtrend: Price effectively breaks above the downtrend line, signaling the first sign of bearish exhaustion.
Common Beginner Mistakes:
Treating breakouts on small timeframes (e.g., 15-minute chart) as real.
Ignoring volume, assuming any price crossing the line is a breakout.
Forcing trendlines in ranging/consolidating markets, leading to frequent false signals.
Note: A trendline break should only be considered an 'alarm', not a standalone reversal basis.
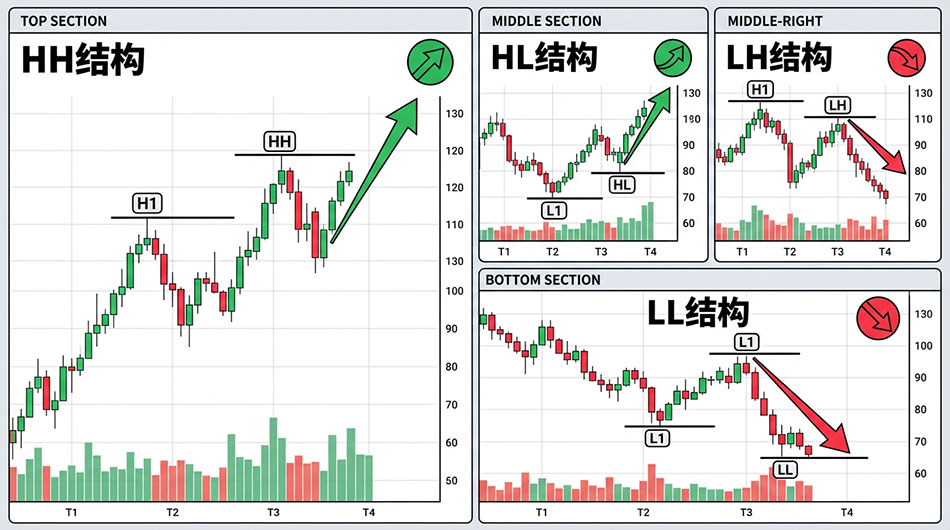
2. Structure Signal 2: High/Low Point Structure Reversal (Most Reliable Signal)
This is the cornerstone for judging trend reversals because it is derived directly from the definition of a trend itself.
Definition of an Uptrend: A series of consecutive Higher Highs (HH) and Higher Lows (HL).
Definition of a Downtrend: A series of consecutive Lower Highs (LH) and Lower Lows (LL).
Therefore, a trend reversal means the reversal of this structure.
Confirmation of a Bearish Reversal (End of Uptrend):
Price fails to make a new high, forming a Lower High (LH).
Subsequently, price breaks below the previous key Higher Low (HL), forming a Lower Low (LL).
Only when both conditions are met can the uptrend be confirmed as reversed into a downtrend.
Confirmation of a Bullish Reversal (End of Downtrend):
Price fails to make a new low, forming a Higher Low (HL).
Subsequently, price breaks above the previous key Lower High (LH), forming a Higher High (HH).
Again, both are needed for the downtrend to be confirmed as reversed into an uptrend.
Why is it the most reliable?
It is based on the fundamental structure of the trend, requiring no guessing of tops or bottoms.
It applies to all timeframes, from monthly charts to 1-hour charts, following the same logic.
Most Common Beginner Mistakes:
Seeing only one HL and rushing to declare "bull market is here," ignoring the need to break the previous LH for confirmation.
Misidentifying key highs and lows in complex ranging markets.
3. Structure Signal 3: Key Moving Average / MA Band Flip (Momentum & Energy Confirmation)
Moving averages represent the market's "cost line," and their direction indicates the average momentum. We commonly use the combination of EMA21 (short-term) and EMA55 (medium-term) to judge.
Manifestations of Momentum Reversal:
Price Action: Candles transition from being consistently suppressed by a key MA (e.g., EMA55) to holding firmly above it.
MA Direction: The key MA itself changes from sloping downwards to flattening out, and eventually turning upwards.
MA Combination: The short-term MA (EMA21) crosses above the long-term MA (EMA55), forming a "Golden Cross" as confirmation of upward momentum; the opposite is a "Death Cross".
Function of this Signal:
It filters out many false breakouts and false reversals. Even if price briefly breaks a trendline, its reliability is questionable if it hasn't held above a key MA.
It helps us judge the "sustainability" of a new trend, not just a temporary bounce.
Common Beginner Misjudgments:
Thinking "price touching EMA21 is a buy signal," completely ignoring the fact that the MA might still be sloping downwards.
Using Golden/Death Crosses as the sole entry and exit signal, ignoring their inherent lagging nature.
A leading global cryptocurrency platform,suitable for both beginners and experienced traders.
New user benefit: 20% off trading fees upon registration!!
4. How to Combine the Three Structure Signals? (Reversal Confirmation Model)
A single signal is always fragile. The reliability of a reversal increases dramatically only when multiple signals resonate.
We provide a concise yet powerful "Reversal Confirmation Model":
Trend Reversal Confirmation = Trendline/Channel Break (Alarm) + High/Low Point Structure Reversal (Core) + Key MA Flip (Confirmation)
Example: How to confirm the reversal of a downtrend?
Step 1 (Alarm): Price strongly breaks above the downtrend line connecting multiple highs.
Step 2 (Core): During a pullback, price does not make a new low, forming a Higher Low (HL). Subsequently, it breaks upwards past the previous Lower High (LH), forming a Higher High (HH). At this point, the downtrend structure is broken, and an uptrend structure is preliminarily established.
Step 3 (Confirmation): Throughout this process, price has effectively held above the EMA55, and the EMA21 has crossed above the EMA55 forming a Golden Cross, with both MAs starting to diverge upwards.
When these three signals appear sequentially and corroborate each other, a high-probability trend reversal is confirmed.
5. Common "False Reversal" Scenarios: Three Situations Beginners Fall Into
- False Breakout: Price briefly breaks a trendline or previous high but quickly falls back, with low volume.
- How to Avoid: Wait for the candle's close to confirm the breakout and observe if volume increases.
- Bounce, Not Reversal: Price stages a strong bounce but fails to form an HH/HL structure, then falls back again to make new lows.
- How to Avoid: Patiently wait for the confirmation of Step 2 "High/Low Point Structure Reversal." Don't rush into a heavy position on the first bounce.
- Bull Trap / Distribution: During a downtrend, a bounce suddenly sees massive volume at a certain level, but price cannot continue rising. This is a classic sign of smart money using the bounce to distribute.
- How to Avoid: Observe where the volume peak occurs. Healthy uptrends show "volume and price rising together," while distribution at tops often shows "high volume, price stalling."
6. Practical Case Study: Verifying a Real Reversal Using the Three Structure Signals
Let's review a bottom reversal for BTC in early 2023.
Background: BTC was in a long-term downtrend.
- Signal 1 (Structure Breakdown): In mid-January, price effectively broke the long-term downtrend line from the 2022 highs, issuing an initial alarm.
- Signal 2 (Structure Reversal): After the breakout, price pulled back to form a clear Higher Low (HL). Then, in early February, it strongly broke above the previous key Lower High (LH), formally establishing the HH-HL uptrend structure.
- Signal 3 (Momentum Confirmation): Throughout January and February, price steadily held above the EMA21 and EMA55, and the two MAs formed a Golden Cross, entering a bullish alignment.
Why was this signal trustworthy? Because the three signals formed a clear resonance.
Beginner Pitfall: Rushing to go all-in on the first breakout of the downtrend line. A more robust approach would be to wait for the HL and HH structure to form and enter on a pullback.
A leading global cryptocurrency platform,suitable for both beginners and experienced traders.
New user benefit: 20% off trading fees upon registration!!
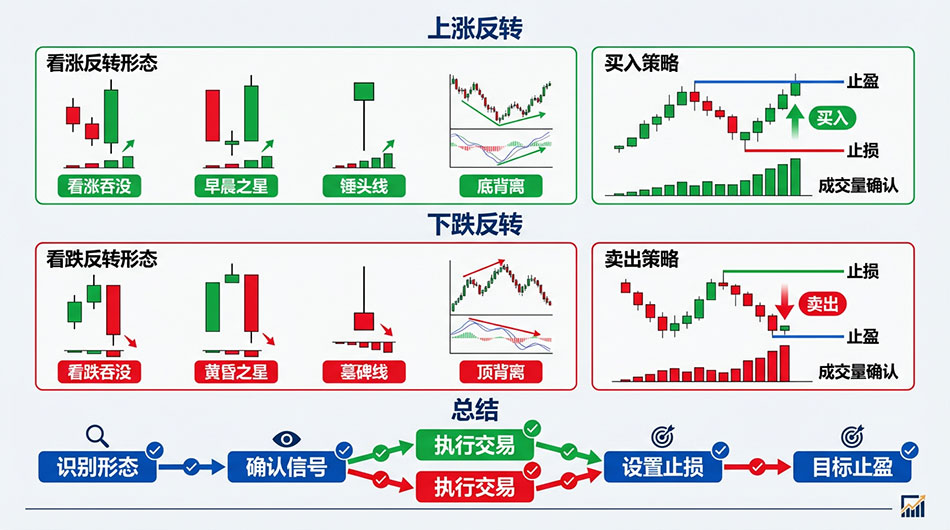
7. Summary: Core Principles for Judging Trend Reversals
Reversal comes from structure, not emotion: Ignore your fear and greed; focus on structural changes on the chart.
Single signals are unreliable; resonance is key: The three signals are like three locks, jointly opening the door to reversal trading.
The larger the timeframe, the more reliable the signal: One signal on the daily chart is far superior to ten signals on the 1-hour chart.
Steady wins the race: The more violent the V-shaped reversal, the more likely it is a trap. Solid reversals usually require time to develop.
8. FAQ - Frequently Asked Questions
Q1: Do I need all three signals to appear before trading?
A: Not necessarily, but professional traders typically wait for at least the two core signals of "Structure Breakdown" and "Structure Reversal" to appear simultaneously. The more signal resonance, the higher the success rate, but the entry point might be slightly later.
Q2: Which timeframe is best for confirming reversals?
A: For beginners, the 4-hour and daily charts are the most stable with the fewest false signals. Timeframes of 1 hour and below have too much noise and are not recommended as primary judgment tools.
Q3: Should I enter immediately after a reversal signal appears?
A: Not recommended. The market often has a "pullback confirmation" process. A safer strategy is to wait for signal confirmation and then enter on a pullback to the broken trendline or key moving average, offering a better risk-reward ratio.
Q4: Does a Golden Cross mean a trend reversal?
A: This is a common misconception. Golden/Death Crosses are tools for confirming trends, not predicting them. They lag behind price action and are ineffective when used alone. They must be combined with leading signals like high/low point structures for a comprehensive judgment.
Further Reading
《How to Identify False Breakouts? Three Most Common Traps Set by Smart Money》
《Guide to Choosing a Trading Timeframe: How to Use 1m, 1H, and Daily Charts?》
