
How to Identify False Breakouts? The Three Most Common Traps Set by Market Makers
In the cryptocurrency market, a "false breakout" is one of the most common and headache-inducing traps for beginners. It appears to be a clear signal of a trend starting, but is actually a carefully orchestrated scam by whales and large funds, specifically designed to harvest retail traders using their "FOMO" (Fear Of Missing Out) emotions.
Many beginners easily fall into this trap: they see the price break through a previous high and rush to buy, or see a long bullish candlestick and think a strong trend is coming. The result is often that shortly after entering, the price quickly reverses, leaving them with a trapped position and full of confusion. Understanding and identifying false breakouts is a required course for every trader moving from beginner to maturity.
A leading global cryptocurrency platform,suitable for both beginners and experienced traders.
New user benefit: 20% off trading fees upon registration!!
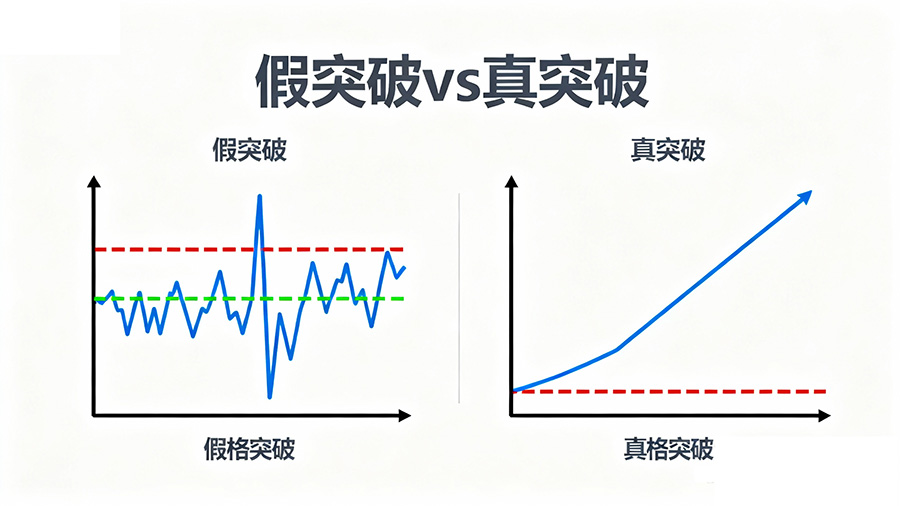
1. What is a False Breakout?
A false breakout occurs when the price briefly breaks through a key technical level (such as support, resistance, or the boundary of a consolidation range), but fails to maintain the new price level and quickly reverses back into the original price range.
Two intuitive characteristics:
- "Rapid decline after a volume spike": The breakout is often accompanied by a surge in trading volume, creating an illusion of high market sentiment, but the price quickly peaks and falls, leaving a long wick.
- "Insufficient buying and selling support": The breakout is merely a "momentary pass" through the price level. Neither are buyers willing to keep buying at higher prices, nor are sellers willing to admit defeat and exit, causing the breakout to lack sustainability.
False breakouts most commonly occur near the upper and lower edges of consolidation ranges, historical highs or lows – key areas where most traders place their stop-loss orders.
2. Three Common Whale "False Breakout Traps"
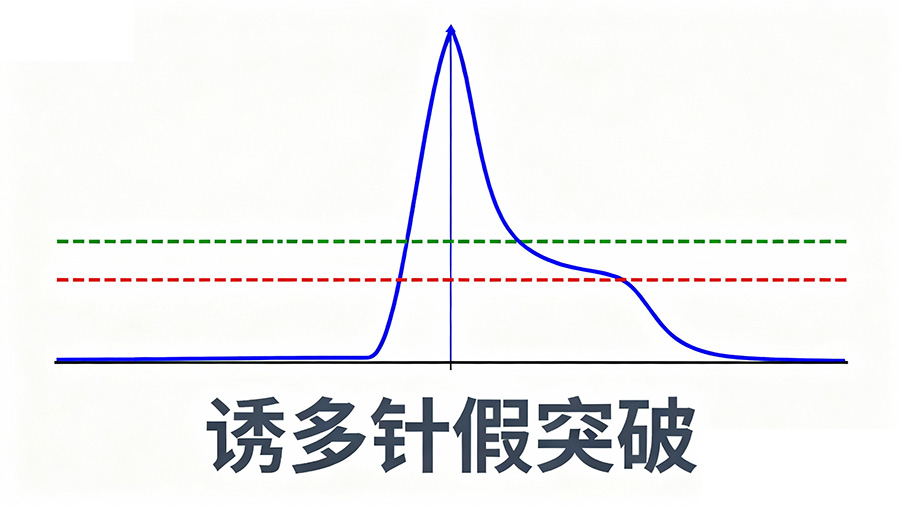
1. "Bull Trap" False Breakout (Long Upper Wick)
Manifestation: The price quickly breaks above a consolidation range or previous high, forming a candlestick with a very long upper wick (e.g., a shooting star), then rapidly falls, trapping all late buyers.
Whale Logic: Using a rapid price increase to attract technical traders and those driven by FOMO to buy, allowing the whale to distribute their holdings at the high. When buying pressure dries up, the price naturally collapses.
How to Identify:
The breakout has a huge volume spike, but the candlestick body is very small or even closes bearish, indicating insufficient real buying pressure.
Commonly seen in areas with obvious overhead resistance.
On lower timeframes (e.g., 1-minute, 5-minute), signals of a violent pullback will be visible.
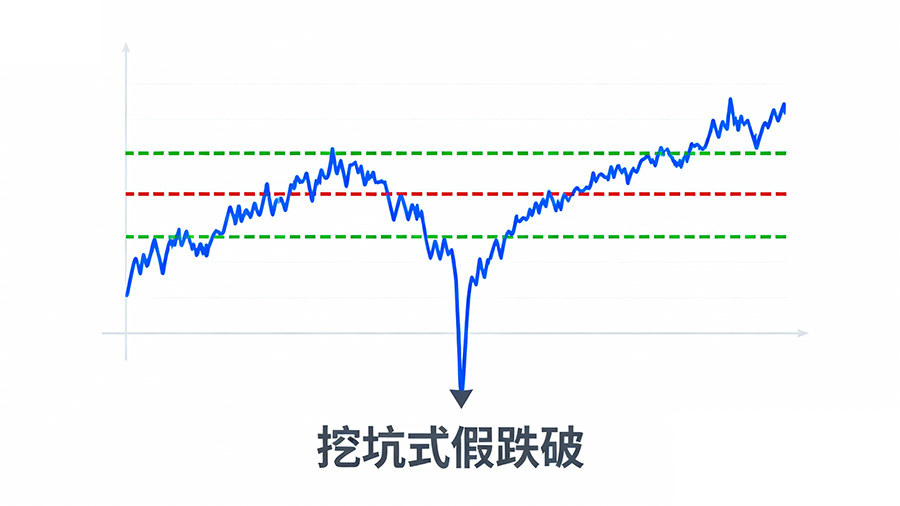
2. "Stop Hunt" False Breakdown (Washout)
Manifestation: The price suddenly breaks down through a key support level, creating panic of a breakdown. However, after triggering many retail traders' short or long stop-losses, it quickly reverses in a V-shape pattern, climbing back above the support level.
Whale Logic: By creating panic, they force retail traders holding long positions to cut losses, while tempting speculators to open short positions. The whale uses this opportunity to accumulate cheap coins at the low, preparing for a subsequent rally.
How to Identify:
The key feature is a "quick recovery after the breakdown," forming a long lower wick (e.g., a hammer candlestick) at the bottom.
The decline might occur on decreasing volume, but the recovery happens on increasing volume – this volume-price structure is more reliable.
3. Range False Breakout (Consolidation Trap)
Manifestation: During range-bound trading, the price occasionally spikes slightly above or below the range boundary, but the breakout momentum and sustainability are very weak. It quickly falls back into the range, continuing the original consolidation pattern.
Whale Logic: When the trend is unclear, they test the range boundaries to gauge market reaction and the distribution of retail stop-loss orders, preparing for the eventual true directional move.
How to Identify:
The breakout lacks continuous volume support; usually only a single candlestick shows a volume spike.
Volume-price divergence: Price makes a new high/low, but volume is lower than during a previous genuine breakout.
The price returns inside the range very quickly, with almost no hesitation.
A leading global cryptocurrency platform,suitable for both beginners and experienced traders.
New user benefit: 20% off trading fees upon registration!!
3. How to Identify False Breakouts in Live Trading? (Four Essential Signals for Beginners)
Watch Volume: Breakout Must Be "Voluminous and Sustained"
A genuine breakout requires continuous capital push. If only a single candlestick shows high volume, followed by a rapid volume contraction, it's often a sign of a false breakout. "Price breaks, but volume doesn't" is a golden rule for identifying false breakouts.
Watch Candlestick Structure: Long Wicks are a Warning
At key levels, if the breakout candlestick has an abnormally long wick, it's a strong warning of whale testing and potential reversal. The smaller the body and the longer the wick, the higher the uncertainty and risk.
Watch for Retest: A True Breakout Will "Hold"
The standard process for a true breakout is: Breakout → Retest of support/resistance → Continued move up/down. A false breakout lacks this "retest confirmation" step. It often loses the key level immediately after the breakout, indicating the market doesn't accept the new price.
Multi-Timeframe Confirmation: Don't Just Look at One Timeframe
Use the "sandwich rule" to filter. For example, when the 1-hour (H1) chart shows a breakout, check if the 4-hour (H4) or daily (D1) chart is also at a key level showing similar strength. If the lower timeframe breaks out, but the higher timeframe is still suppressed under a trendline or structure, the probability of a false breakout is very high.
4. How to Deal with False Breakouts? Three Safest Strategies for Beginners
Don't Chase Breakouts, Wait for "Secondary Confirmation"
This is the safest strategy. Give up the idea of catching the "first move." Patiently wait for the price to retest the key level after the breakout and hold effectively before entering. You might sacrifice some profit, but safety is greatly improved.
Place Stop-Losses "Outside the Structure"
The goal of a false breakout is to trigger most people's stop-losses. Therefore, don't place your stop-loss too close to the support/resistance line. Instead, place it outside the entire consolidation range or technical structure, giving the market some room for "noise."
Test the Market with a Small Position, Add After Confirmation
At a suspected breakout point, first test with a small position. If the subsequent price action proves it's a true breakout and your position starts showing profit, then choose to add to your position on the retest. This way, even if it's a false breakout, your loss is controlled.
A leading global cryptocurrency platform,suitable for both beginners and experienced traders.
New user benefit: 20% off trading fees upon registration!!
5. Summary: All "False Breakouts" Essentially Have One Goal – Tricking You into the Wrong Trade
Ultimately, the sole purpose of whales creating false breakouts is to use technical deception to lure retail traders into establishing positions in the wrong direction, thereby completing their own accumulation or distribution.
For beginners, the most important thing is not to accurately predict every true or false breakout, but to "control yourself and not be easily tempted." By comprehensively analyzing structural strength, volume authenticity, and whether the retest holds, you can build an effective firewall, significantly reducing the probability of falling into false breakout traps. Remember, in the market, surviving longer is more important than getting rich quick.
