
What Is Volume Analysis? How to Read Price-Volume Relationships
Today's guide is a must-read for crypto newbies—short, practical, and straight to the point. No fluff, just the logic I've personally tested and verified.
1. What Exactly Is Trading Volume?
Think of it this way: Volume is the "sound of money." Price tells you where the market is going; volume tells you if that move is real.
In crypto, Volume refers to the total quantity of a coin traded, or its total dollar value, within a specific time frame. For example, if you see "BTC 24-hour volume is $20 billion," it means Bitcoin was bought and sold for a total of $20 billion in the past day.
Why is volume so important? Because a few large players can temporarily pump or dump the price, but volume requires real money. While volume can be faked, it's usually the "size" that's manipulated, not the "price-volume relationship pattern."
Imagine price and volume like driving a car: Price is the speedometer, volume is the gas pedal. If the speed goes up but you're not pressing the gas, someone is pushing the car, and it will eventually slow down. Understanding this puts you ahead of 80% of beginners who only stare at candlesticks.
A leading global cryptocurrency platform,suitable for both beginners and experienced traders.
New user benefit: 20% off trading fees upon registration!!
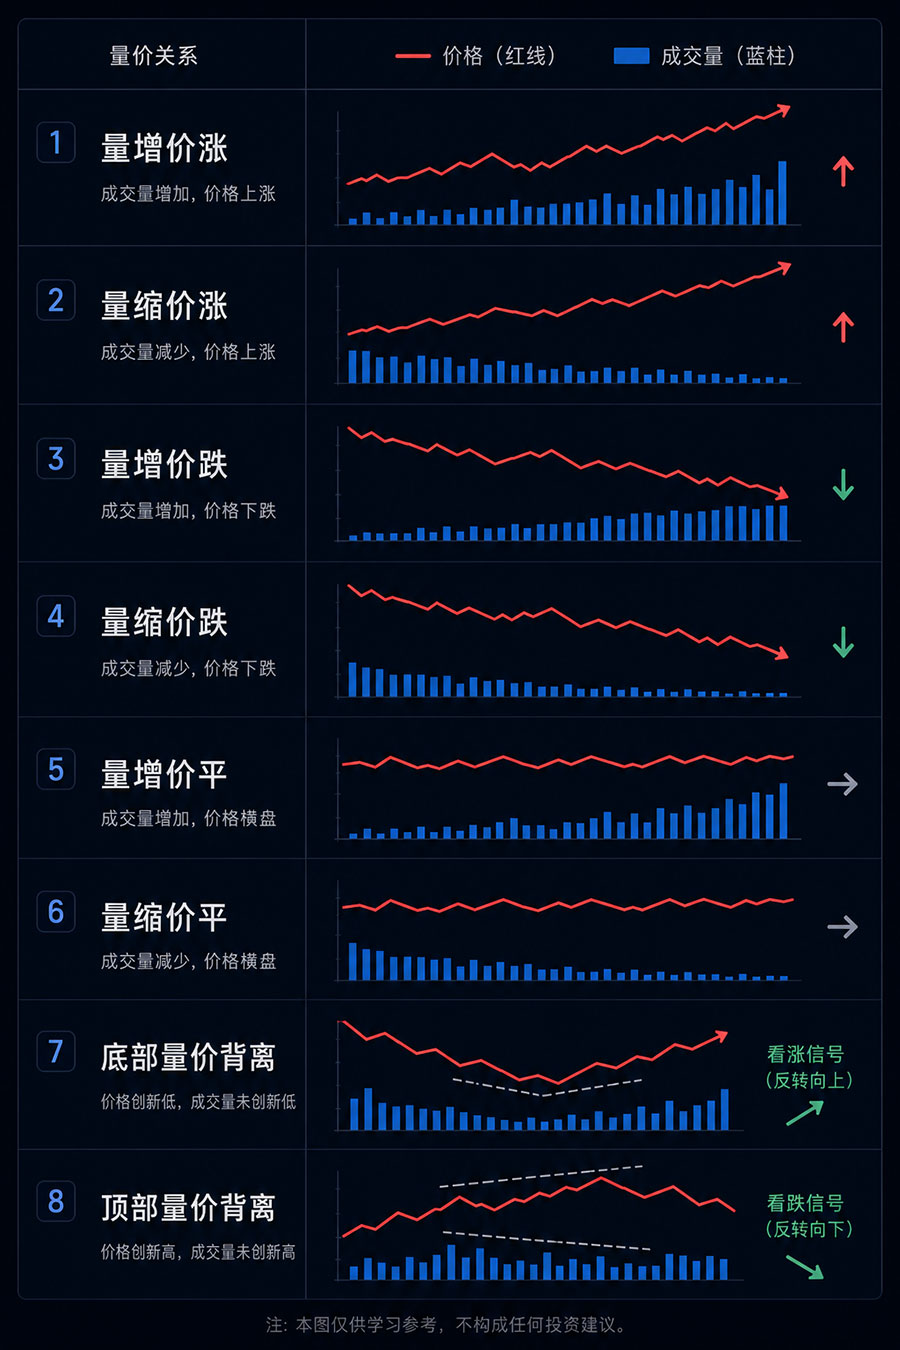
2. Price-Volume Relationships: Master These 8 Patterns to Read Market Intentions
Price-volume relationships can be simple or complex. The core idea is: Volume precedes price, and price moves need volume confirmation to be reliable.
I've organized the 8 key patterns into a table, perfect for mobile viewing. Use this for your daily trading review:
| Market Phase | Price-Volume Pattern | Underlying Logic | Action |
| Early Uptrend | Volume Up, Price Up | Real buying pressure, capital alignment | Hold confidently, trend is healthy |
| Late Uptrend | Volume Down, Price Up | No followers, forced pumping to distribute | Prepare to exit, bearish divergence |
| Early Downtrend | Volume Up, Price Down | Panic selling, delay means loss | Get out first, don't catch a falling knife |
| Late Downtrend | Volume Down, Price Down | No more selling pressure, exhaustion | Watch closely, potential bottom |
| Bottom Zone | Volume Up, Price Flat | Smart money accumulating quietly | Monitor, wait for breakout |
| Top Zone | Volume Up, Price Flat | Smart money distributing quietly | Exit in batches, don't hesitate |
| Continuation (Uptrend) | Volume Down, Price Down | Market maker shaking out weak hands | Don't exit, it will rise again after the shakeout |
| Continuation (Downtrend) | Volume Up, Price Up | Bull trap, fake rally to lure buyers | Don't chase, the bounce is an exit opportunity |
The table above summarizes the classic "Eight Laws of Price-Volume." A reminder: Volume is essentially a record of trades between buyers and sellers. High volume at the top could mean massive churn, not necessarily all distribution. However, in most cases, high volume combined with a stalled price is a warning sign, as history shows this often precedes a downturn.
In practice, the rule "high volume at highs often means smart money is exiting; high volume at lows often means smart money is accumulating" holds true. My trading rule is simple: You can chase breakouts, but only with increasing volume. You can buy dips, but only when volume is shrinking. Doing the opposite is a recipe for losses.
3. What Does Real 2025 Trading Data Tell Us?
The full year 2025 market data is out. I've gathered key figures from sources like CryptoQuant, CME, and Binance. All real data:
The total annual trading volume for the crypto market in 2025 reached $79 trillion, with $18 trillion in spot and $61 trillion in futures. Futures accounted for about 77%. What does this mean? Over three-quarters of trading volume comes from high-leverage contracts; spot traders are now the minority. High futures volume means concentrated leverage risk. Be cautious with copy trading, as many novice stop-loss orders can be triggered prematurely by cascading liquidations before the price even reaches them.
For perpetual swaps, daily volume in December 2025 hit a staggering $1.41 trillion, up 31% from the previous month. The average funding rate surged 264% to 0.006%. The funding rate is essentially the cost of holding a long position. When it spikes rapidly, it usually means longs are overcrowded, significantly increasing the risk of a market correction.
Bitcoin's average daily spot volume has also increased significantly, from $4-13 billion in the last bull run to $8-22 billion now. This means Bitcoin's large capital base has genuinely grown. There are more whales, and the influence of small retail traders is diminishing.
Observing whether Bitcoin's daily volume exceeds $20 billion is a key threshold for determining if the market is "retail-driven" or "institution-driven." Current levels suggest institutions are becoming the core price setters.
4. A Trap 99% of People Don't Know: Fake Volume
Despite its importance, you must be wary of one issue: Wash Trading. This is the widespread practice of "buying and selling to oneself" to inflate volume. Wash trading involves one party or related parties buying and sometimes simultaneously selling their own tokens on the open market to artificially boost volume.
In late November 2025, research indicated that wash trading in certain prediction markets accounted for up to 60% of total volume. This dropped to 5% by May but rose back to around 20% by October. This shows that the "water" in volume data can fluctuate wildly over time.
In November 2025, fintech experts publicly warned about widespread volume inflation in the crypto industry. So how do you identify real vs. fake volume? Three practical checks:
- Check the number of large buyers: If volume is high but there are very few buyer addresses, it could be self-trading.
- Check community activity: High volume without corresponding community discussion and user growth is likely fabricated.
- Cross-exchange comparison: Volume trends for the same coin should be roughly similar across different exchanges. If one exchange shows a sudden, isolated spike while others are quiet, the data is suspicious.
A leading global cryptocurrency platform,suitable for both beginners and experienced traders.
New user benefit: 20% off trading fees upon registration!!
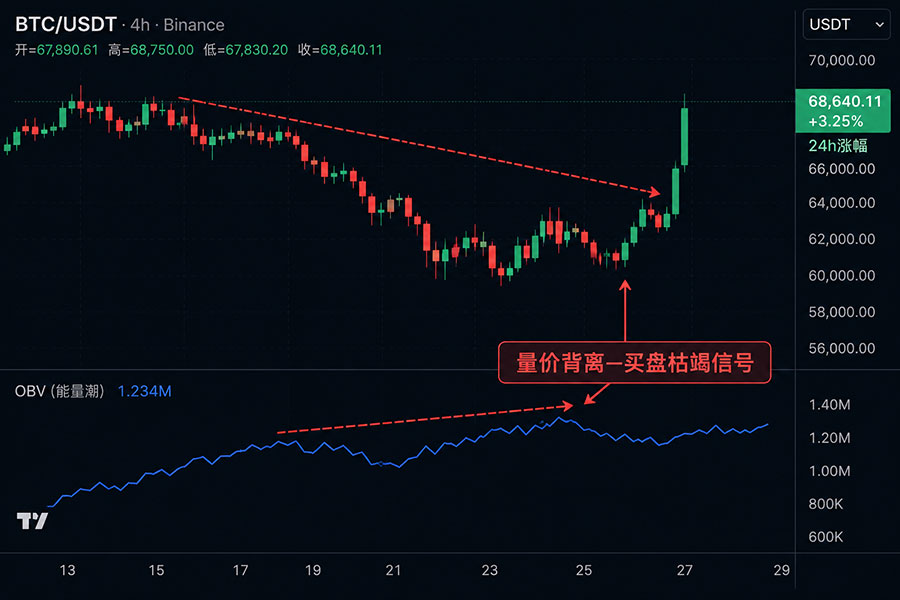
5. One Chart to Understand "Price-Volume Divergence": The Core Signal for Tops and Bottoms
The patterns "Volume Down, Price Up" (late uptrend) and "Volume Down, Price Down" (late downtrend) from the table above are technically called "Price-Volume Divergence."
What is divergence? Simply put, it's when price and volume stop confirming each other:
- Bearish Divergence (can't go up anymore): Price makes a new high, but volume is significantly lower than during the previous upswing. This indicates buying power is exhausted – a sell signal.
- Bullish Divergence (can't go down anymore): Price makes a new low, but volume is significantly lower than during the previous downswing. This indicates selling pressure is exhausted – a buy signal.
Price-volume divergence is one of the easiest and most reliable volume analysis methods for beginners. It works even better when combined with the OBV indicator.
6. Practical Application: How OBV (On-Balance Volume) Helps You Gauge Capital Flow
Beyond the basic volume histogram, there's a professional volume indicator called OBV (On-Balance Volume). The principle is simple: Add volume on up days, subtract volume on down days, and accumulate the result. Think of OBV as a running record of capital inflows and outflows.
The two classic uses of OBV are:
- If price is rising and OBV is also rising: Buying pressure is genuinely strong, you can continue to hold.
- If price is rising but OBV is flat or falling: This is price-volume divergence, indicating buying pressure is weakening, and you should consider exiting.
A useful tip: When the price is consolidating and candlesticks are flat, watch whether OBV is rising or falling. If OBV is quietly climbing, it suggests large capital is entering in batches, and a breakout may follow. OBV doesn't give direct buy/sell signals, but it's excellent for confirming trend reliability and determining if smart money is accumulating or distributing. I usually place the OBV line below the candlesticks. When the OBV line makes a new high before the price breaks out, placing a preemptive order can often get you in before the trend starts.
FAQ (Frequently Asked Questions for Beginners)
Q1: What does a sudden surge in volume mean?
A volume spike itself doesn't indicate direction; you must look at the price. High price + high volume + stalled price = sell. Low price + high volume + price stabilizing = buy. A sudden spike after a long period of low volume = potential trend change, requiring close attention.
Q2: Why does price sometimes surge on high volume, only to crash the next day?
This is likely a "bull trap." Market makers create a high-volume green candle to lure buyers in, then quietly distribute their holdings as retail traders follow. In this case, check the position – if it's another volume spike after a sustained rally, it's actually a signal to reduce your position.
Q3: What is the relationship between volume and turnover rate?
Turnover Rate = Volume ÷ Circulating Supply × 100%. A high turnover rate means tokens are changing hands quickly, indicating high activity. However, if the turnover rate spikes to an extreme level for a small-cap coin, be wary of market makers inflating volume.
Q4: Where should a beginner start practicing reading volume?
Spend 10 minutes daily on the BTC/USDT trading page. First, look at the candlesticks, then look at the volume histogram below. Force yourself to answer one question: "Which pattern from the table does today's price-volume relationship fit?" Do this for two weeks, and you'll develop a feel for it.
Q5: Can I make trading decisions based on volume alone?
No. Volume is a supporting tool, not a holy grail. You must combine it with the price level (high or low), trend direction (uptrend or downtrend), and fundamental information. Trading based on a single indicator will likely lead to losses.
Price-volume relationships aren't magic; they are a thermometer for market sentiment. After a big rise, a correction is due; after a big fall, a bounce is due. Volume can tell you these
