
What Are Support and Resistance? A Beginner’s Guide to Key Levels (With Charts)
In technical analysis, support and resistance are the most core and enduring concepts. They are the grammar of market language and the foundation for understanding price charts. Many novice traders frequently "buy high and sell low" precisely because they cannot read these key levels on the chart.
This article will help you fundamentally understand the logic behind the formation of support and resistance, and master several simple, efficient methods that can be immediately applied to live trading, taking your first step from "trading by feeling" to "trading by plan." Note: This article is suitable for beginners and those starting from zero.
A leading global cryptocurrency platform,suitable for both beginners and experienced traders.
New user benefit: 20% off trading fees upon registration!!
1. What is the Essence of Support and Resistance?
Support and resistance are not necessarily an exact line, but rather a zone. Simply put:
Definition of Support
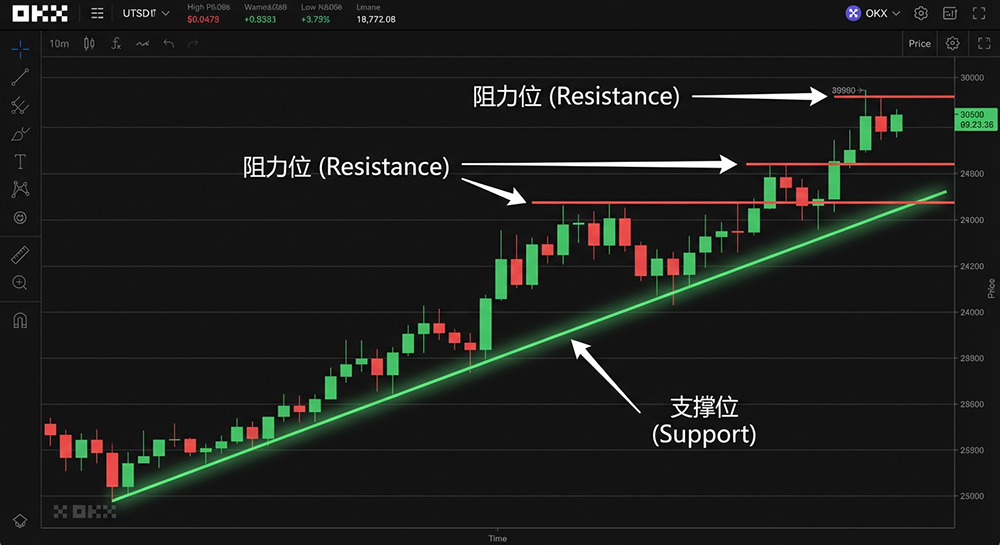
When the price falls to a certain area, it seems to hit an "invisible net," the decline is halted, and it begins to bounce back. This area is support. It represents a position where buying power starts to dominate the market, with concentrated buy order demand emerging.
Definition of Resistance
When the price rises to a certain area, it seems to hit an "invisible wall," the uptrend is contained, and it begins to pull back. This area is resistance. It represents a position where selling power starts to dominate the market, with concentrated sell order supply being released.
Why Do Support and Resistance Form? (Logic of Capital and Sentiment)
- Cost Basis Zone: A large number of investors bought or sold in this area. When the price returns here, they may choose to close positions or add to them, thus creating a balance of power.
- Historical High-Volume Zone: The market has undergone prolonged trading and hand-changing at this level in the past, forming a large number of position costs, naturally making it an important psychological threshold.
- Market Sentiment "Memory Effect": Market participants remember where the price reversed previously, forming a conditioned reflex of collective behavior.
- Price Retest Point After Failed Breakout: When the price attempts to break a key level and fails, that level becomes even more important, serving as a starting point for the next challenge.
2. How Can Beginners Identify Key Support and Resistance? (Four Simple Methods)
In charting tools like TradingView, you don't need complex indicators; you can find them just by looking at the chart with your eyes.
The following methods are suitable for all beginners and require no specialized software.
1. Identifying Key Levels Using "Prior Highs and Prior Lows" (Most Classic)
A previous significant high is a potential resistance for the current rising price.
A previous significant low is a potential support for the current falling price.
In an uptrend, the constantly rising highs and lows; in a downtrend, the constantly falling highs and lows – these structural points are the most reliable sources of key levels.
2. Identifying Key Levels Using "High-Volume Zones" (Ranges)
When the price oscillates back and forth within a certain range, consolidating sideways for a long time, this entire sideways zone becomes a powerful support or resistance band.
Key Point: The longer the sideways consolidation, the higher the importance of this zone. If the price breaks out of this range with high volume, the original resistance becomes new support, and vice versa.
A leading global cryptocurrency platform,suitable for both beginners and experienced traders.
New user benefit: 20% off trading fees upon registration!!
3. Identifying Dynamic Support and Resistance Using "Moving Averages"
Moving averages (e.g., MA20, MA60) can represent dynamic support or resistance.
In an uptrend, the price often finds support when it pulls back to the moving average and then moves higher again.
Note: Moving average support works best in clear trending markets. In a ranging market, moving averages can be crossed back and forth repeatedly, losing their reference value.
4. Identifying Key Levels Using "Trendlines and Channels"
Connecting consecutive rising lows can draw an uptrend line (support); connecting consecutive falling highs can draw a downtrend line (resistance).
Reliability: The more times a trendline is touched and causes a bounce, the stronger its validity. When the price eventually breaks the trendline, it often signals a trend reversal.
3. How to Determine if Support/Resistance is "Valid"? (Three Essential Criteria)
If you are a complete beginner, the method below is the easiest basic judgment method to get started with quickly. Know that not every line drawn is important; you need to learn to filter.
1. Has it been "Tested Multiple Times"?
The more times a level is tested by the price and produces a reaction, the more valid it is. It needs at least two effective reactions to have high reference value.
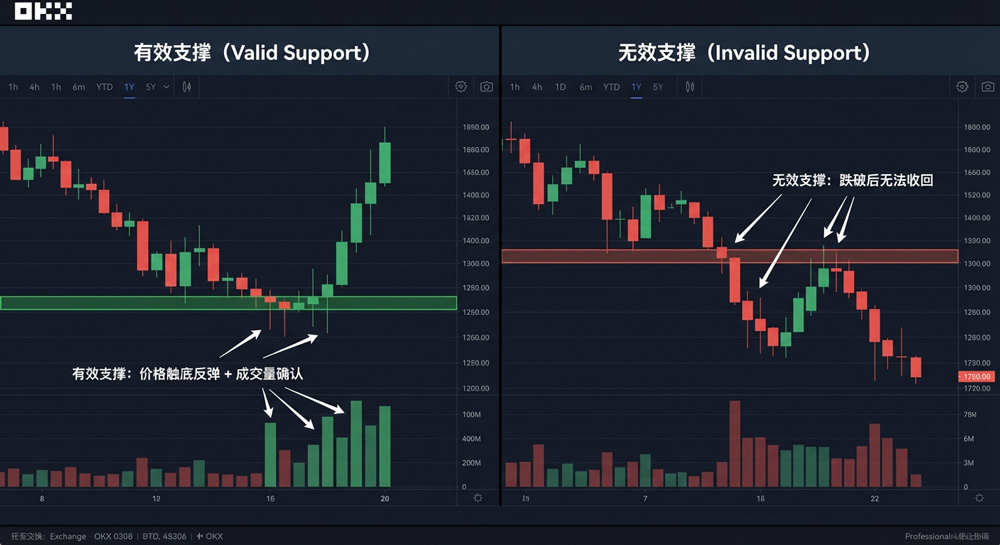
2. Does it Come with Changes in Trading Volume?
- True Breakout: When the price breaks through a key resistance, it needs to be accompanied by high volume, indicating strong capital consensus.
- True Support: When the price retests a key support, ideally it should be a decline on shrinking volume, followed by a rebound on increasing volume at the support level, indicating buying pressure rushing in after selling pressure dries up.
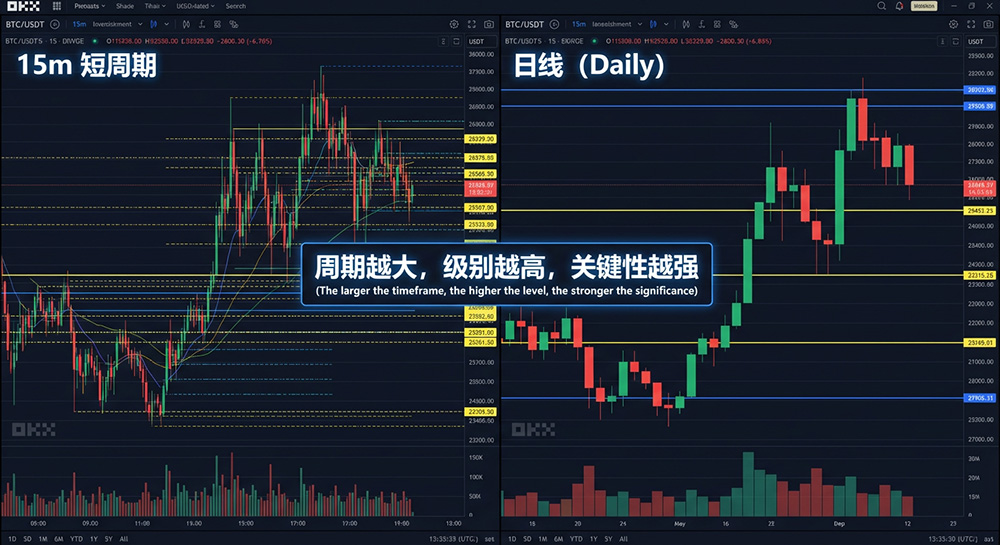
3. Does it Overlap with Key Levels from Higher Timeframes?
Key levels with larger time spans (e.g., weekly, monthly) are referenced by more traders. This is a trump card technique to improve win rate. If a support level on the 1-hour chart coincides exactly with a prior low support level on the 4-hour or daily chart, the support power at this level will be very strong. Key levels on higher timeframes are levels that major market players also reference.
A leading global cryptocurrency platform,suitable for both beginners and experienced traders.
New user benefit: 20% off trading fees upon registration!!
4. Common Mistakes with Support and Resistance in Live Trading
Mistake: Treating Every Swing High and Low as a "Key Level"
There are many highs and lows on a chart. If you draw lines on all of them, the chart becomes cluttered. The key is to only take the most obvious and structurally significant points.
Mistake: Blindly Believing a Single Candle Wick Piercing is a Breakout
Market makers often create "false breakout" traps. To judge a true breakout, see if the closing price is stably on the other side of the key level. A piercing with a long wick, if the closing price retracts, is not a valid breakout.
Mistake: Blindly Buying the Bottom or Selling the Top at Key Levels
A key level is a "reaction zone," not a "prediction point." The correct approach is to wait for clear signs of stopping or stalling (e.g., hammer candlestick, engulfing pattern) within this zone before considering action.
5. How to Use Support and Resistance to Formulate a Trading Strategy?
Using Key Levels to Set Entry and Exit Points
- Going Long: Buy near a key support level after seeing price stabilization signals.
- Going Short: Sell near a key resistance level after seeing price rejection signals.
Using Key Levels to Set Stop Losses
This is one of the most core uses of support and resistance. Place the stop loss just outside the key level, allowing some room for market "noise." For example, when going long at a support level, place the stop loss slightly below the support.
Using Multi-Timeframe Confluence to Improve Win Rate
Higher Timeframe for Direction: Find the main trend and key levels on the daily chart.
Lower Timeframe for Entry: On the 1-hour or 4-hour chart, wait for the price to pull back to the key level from the higher timeframe and look for a more precise entry signal.
6. Support and Resistance FAQ
Q1: Can support and resistance perfectly predict price movement?
A: No. They provide high-probability reaction zones, not 100% accurate prediction points. The market always has uncertainty; you must combine them with stop losses to manage risk.
Q2: Does a wick piercing support count as a breakdown?
A: No. Only when the closing price (or the candle body of your trading timeframe) effectively breaks below the support level can it be considered a breakdown. A long lower wick piercing on a single candle is usually a false signal.
Q3: How to identify a "false breakout"?
A: Typical characteristics of a false breakout are: low volume during the breakout, extremely long candle wicks, and the inability to hold the level after the breakout, quickly returning to the original range.
Q4: Difference in identifying key levels between trending and ranging markets?
A: In trending markets, prior highs/lows and trendlines are most effective. In ranging markets, the upper and lower boundaries of the high-volume consolidation zone are the core support and resistance.
Q5: Which timeframes should a beginner use to draw support and resistance?
A: It is recommended for beginners to start with the "1-hour + Daily" combination. Use the daily chart for the larger trend and core key levels, and use the 1-hour chart to find specific trading opportunities.
Q6: Should support and resistance be drawn as a line or a zone?
A: Beginners often draw them as a line, but the correct way is to draw them as a price zone, because prices have normal fluctuation space near key levels.
A leading global cryptocurrency platform,suitable for both beginners and experienced traders.
New user benefit: 20% off trading fees upon registration!!
7. Conclusion: Support and Resistance are the First Step to Understanding Market Structure
Truly valuable key levels are the traces left by market capital behavior. The more obvious they are, the more times they are validated, and the more they are confirmed by higher timeframes and volume, the more likely they become market consensus.
For beginners, there is no need to make the chart overly complex. The first step to success lies in learning to identify those "key structural points" and observing the price reaction at these levels in conjunction with "volume" and "higher timeframe direction." Mastering this, you will have already surpassed most traders who trade by feeling.
The methods introduced in this article apply to cryptocurrencies like Bitcoin and Ethereum, as well as markets like stocks and forex.
