
How to View Contract Depth on Major Exchanges? A Beginner's Practical Guide
Have you ever experienced a situation where the actual execution price when opening or closing a position was far from your expected price, eating into your profits? This is likely because you overlooked "contract depth." Learning to read depth is the first step to becoming a rational trader.
A leading global cryptocurrency platform,suitable for both beginners and experienced traders.
New user benefit: 20% off trading fees upon registration!!
1. Why Can't You Ignore Contract Depth?
During periods of intense market volatility, you'll face a harsh reality: you want to close a position quickly, but the execution price is much worse than you anticipated. This price difference is "slippage." Contract depth directly determines the size of your trading slippage.
For beginners, especially those using high leverage, ignoring contract depth means:
Higher opening costs, buying at a higher price, selling at a lower price.
Greater losses when closing positions, especially when you need to stop loss urgently. Significant slippage can amplify losses several times over.
This article aims to teach you how to view, understand, and apply contract depth in the most intuitive way, giving you more confidence in every trade.
2. What is Contract Depth?
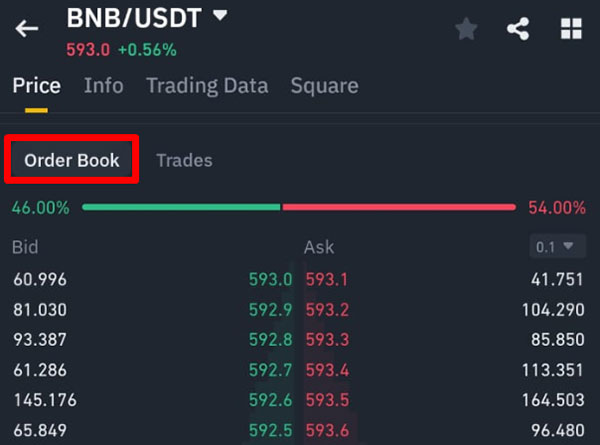
Contract depth, also known as the order book, shows in real-time all the prices buyers are willing to pay and the quantities they want to buy, as well as all the prices sellers are willing to accept and the quantities they want to sell for a specific trading contract (e.g., BTC/USDT).
It has three core functions:
- Measuring market liquidity: Better depth means a healthier market, making it easier for large capital to enter and exit.
- Identifying price support and resistance: Large clusters of buy orders form support, while large clusters of sell orders form resistance.
- Estimating slippage: You can use depth to estimate the impact your order will have on the market and calculate your approximate average execution price.
Depth = Liquidity + Support/Resistance + Slippage Estimation
3. Key Indicators of Contract Depth
To read depth, you need to focus on these four core elements:
1. Bids / Asks
Bids: Located on the bottom, showing the total pending buy orders at different prices. Prices increase from top to bottom.
Asks: Located on the top, showing the total pending sell orders at different prices. Prices increase from top to bottom.
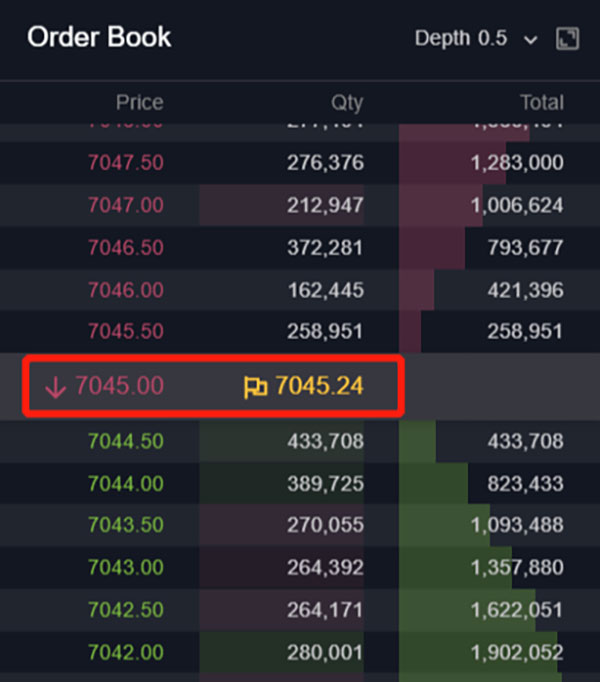
2. Total Pending Order Volume
Refers to the total amount of all buy and sell orders within a specific price range (e.g., $100 above and below the current price). A larger total volume indicates thicker depth, better liquidity, and easier execution of large trades.
3. Spread
Refers to the difference between the best bid price and the best ask price. A smaller spread indicates a more active market and better liquidity. A large spread is common for new or low-liquidity coins and is very unfavorable for traders.
4. Depth Chart
This is a visual representation of the order book. It accumulates the buy and sell order volumes to form two curves.
Buy Curve: Shows the cumulative buying power from the current price downwards.
Sell Curve: Shows the cumulative selling power from the current price upwards.
Application: The wider the gap between the two curves, the better the depth. More overlap indicates intense market competition and thinner depth.
4. How to View Depth on Major Exchanges (Step-by-Step Guide)
Although exchange interfaces differ, the logic for viewing depth is largely the same.
1. Binance
Steps:
Go to the Binance website or App, click on [Trade] -> [USDT-M Futures] or [COIN-M Futures].
Select the trading pair you want, e.g., BTCUSDT, in the top left corner.
In the middle or right side of the trading interface, you'll find the [Depth Chart] or [Order Book] tab.
Interface Analysis:
Order Book: Clearly lists the prices and pending order volumes for each level on both the buy and sell sides.
Depth Chart: Visually displays the distribution of buying and selling power in the form of curves.
The world's largest cryptocurrency exchange by trading volume,leading in security and liquidity.
New user benefit: Enjoy 20% off trading fees upon registration!
2. OKX
Steps:
Go to the OKX website or App, click on [Trade] -> [Perpetual] or [Futures].
Select a trading pair, e.g., BTC-USDT-SWAP.
In the trading interface, click the candlestick chart icon in the top right corner, then scroll down to find [Depth Chart] or [Order Book].
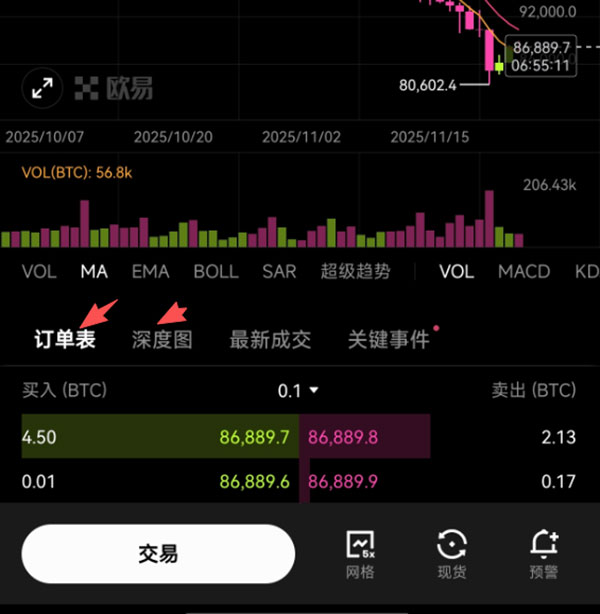
Special Features:
Supports adjusting the display levels, e.g., from "Level 1" to "Level 50", allowing you to view pending orders within different depth ranges.
A leading global cryptocurrency platform,suitable for both beginners and experienced traders.
New user benefit: 20% off trading fees upon registration!!
3. Bybit
Steps:
Go to the Bybit website or App, click on [Trade] -> [USDT Perpetual].
Select a trading pair, e.g., BTCUSDT.
On the right side of the trading interface, you can find [Depth Chart] or [Order Book].
Special Features:
The depth chart supports displaying cumulative pending order volume, giving you a more macro-level understanding of the overall buying and selling power.
5. Practical Tips for Using the Depth Chart
Once you understand the interface, how do you use it to guide your trading?
Identifying Support and Resistance Levels
Support Level: An area on the depth chart where the buy curve suddenly bulges significantly. This indicates a large accumulation of buy orders, and the price will encounter strong buying power here, forming support.
Resistance Level: An area on the depth chart where the sell curve suddenly bulges significantly. This indicates a large accumulation of sell orders, and the price will encounter strong selling pressure here.
Beware of Spoof Orders
A deceptive practice exists in the market: placing massive orders at a certain price level to mislead other traders into thinking there is strong support/resistance, influencing their decisions. Once the market price approaches, these large orders are quickly canceled. Beginners should not blindly trust large orders at a single price level but should combine multiple price levels and candlestick charts for comprehensive judgment.
Slippage Estimation
Suppose you want to buy 10 BTC. You can accumulate the pending sell order volume from the top down until you reach 10 BTC. The price levels you pass through represent your approximate average execution price. If the best ask level only has 1 BTC, buying 10 BTC will push the price up significantly, resulting in huge slippage.
The essence of slippage = which pending orders your order consumes.
6. Tips for Beginners
For beginners, there's no need to overcomplicate things. Remembering the following points can significantly improve your trading experience:
- Focus on the Core: Don't stare at too many levels. Just focus on the pending order volume and spread of the best bid and best ask.
- Choose Mainstream Coins: Avoid using high leverage on obscure coins with extremely thin depth. Prioritize contracts for mainstream coins like BTC and ETH, which have the best depth.
- Combine with Risk Management: Integrate depth analysis with your stop-loss and position sizing. When depth is poor, appropriately widen your slippage tolerance for stop-losses or reduce your position size.
Here is a simple table for reference:
| Item | What Beginners Should Do | Reason |
| Level Focus | Focus only on best bid/ask | Easy to start |
| Coin Selection | Mainstream coins | Good depth |
| Position Size | Small positions | Avoid slippage liquidation |
7. Summary
Contract depth is not a crystal ball for predicting the future, but it is a real-time dashboard for measuring market liquidity and trading costs. We recommend making "checking depth before opening a position" a fixed part of your routine starting today.
Mastering the basic ability to view and understand depth allows you to have a clear expectation of your execution costs before opening a position, avoiding unnecessary losses from significant slippage at critical moments. We suggest cultivating "glancing at the depth before opening a position" as one of your core trading habits.
A leading global cryptocurrency platform,suitable for both beginners and experienced traders.
New user benefit: 20% off trading fees upon registration!!
8. FAQ
Q1: Is deeper contract depth always better?
A: For most traders, yes. Greater depth means better liquidity, lower slippage, and a better trading experience. However, for short-term traders seeking high volatility, a market with too much depth (like BTC) might make rapid price spikes harder to achieve.
Q2: Can the depth chart accurately predict price movements?
A: No. The depth chart only reflects the pending orders at the current moment; it is static. It is mainly used to judge short-term support/resistance levels and estimate execution slippage, and should not be the sole basis for predicting future price direction.
Q3: What is the simplest way for a beginner to read pending orders?
A: The simplest method is: first, look at the spread – a small spread indicates good liquidity. Second, look at the order volume at the best bid and ask levels – large volume indicates intense competition at the current price level, making it less likely to be broken through instantly. Avoid large or high-leverage trades when the spread is wide and order volume is thin.
