
How to Identify Market Trends? Technical Analysis Basics
In financial markets, trend analysis is regarded as the cornerstone of technical analysis. The classic saying "The trend is your friend" is not just a slogan, but a hard-earned lesson learned by countless traders through real money and experience. Understanding, identifying, and following trends are core skills every trader must master.
It's important to clarify that judging a trend is not the same as predicting the market. We cannot accurately foresee every price fluctuation, but we can use scientific methods to identify the current direction and strength of the market. This shift in mindset is crucial—moving from trying to "beat the market" to "understanding and following the market."
A leading global cryptocurrency platform,suitable for both beginners and experienced traders.
New user benefit: 20% off trading fees upon registration!!
In the highly volatile cryptocurrency market, trend analysis is particularly important. This article will systematically introduce the basic methods for judging market trends, helping you build a fundamental framework for scientific market analysis.
1. What is a Market Trend? (Definition and Classification)
The essence of a market trend is the directional movement pattern of price over a certain period. Just as the ocean has tides, waves, and ripples, market price movements also exhibit trend characteristics at different levels.
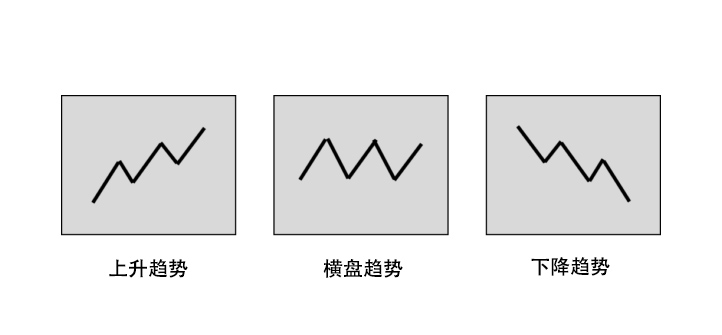
Three basic trend types form the foundation of market analysis:
- Uptrend: Characterized by successively higher highs and higher lows, with each pullback not breaking the previous low.
- Downtrend: Characterized by successively lower highs and lower lows, with each rally not breaking the previous high.
- Sideways/Range-bound: Price fluctuates back and forth within a relatively fixed range, lacking a clear direction.
Dow Theory classifies trends into three levels:
- Long-term Trend: Lasts from months to years, determining the market's primary direction.
- Intermediate Trend: Lasts from weeks to months, representing correction phases within the long-term trend.
- Short-term Trend: Lasts from days to weeks, influenced by market sentiment and immediate news.
Understanding these different trend levels helps us make appropriate trading decisions at the right time. Next, we will start with the most intuitive tools—trend lines and support/resistance—to build a visual method for identifying trends.
2. Trend Lines and Support/Resistance: The First Step in Visual Trend Identification
Trend lines are the most intuitive tool for trend analysis. In an uptrend, we connect successive lows to form an upward trend line; in a downtrend, we connect successive highs to form a downward trend line. An effective trend line requires at least three touch points to confirm its validity.
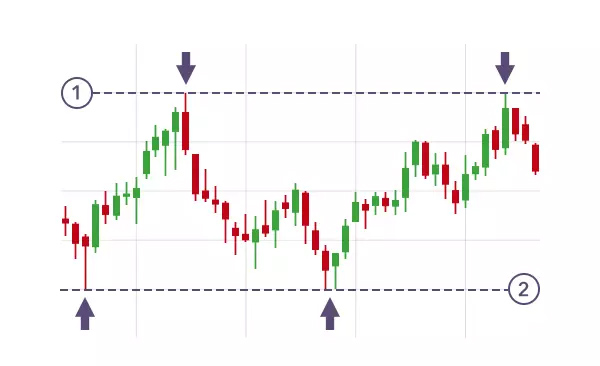
Support and resistance levels are key to understanding market psychology:
- Support: An area where buying interest emerges as price falls, representing the bulls' defense line.
- Resistance: An area where selling interest emerges as price rises, representing the bears' defense line.
- Role Reversal: Once support is broken, it often becomes new resistance, and vice versa.
Practical Analysis Tips:
When price breaks through a significant trend line, accompanied by a role reversal of support and resistance, it often signals a potential trend change. This confluence of multiple signals can improve the accuracy of your judgment.
Trend lines can be subjective, so they should be used in conjunction with indicators like volume or moving averages to increase reliability.
A leading global cryptocurrency platform,suitable for both beginners and experienced traders.
New user benefit: 20% off trading fees upon registration!!
3. Moving Averages (MA): A Quantitative Tool for Trend Direction
Moving averages help filter market noise and identify true trend direction by smoothing out price fluctuations. The Simple Moving Average (SMA) gives equal weight to all prices, while the Exponential Moving Average (EMA) places more emphasis on recent prices.
Practical Application of Moving Average Combinations:
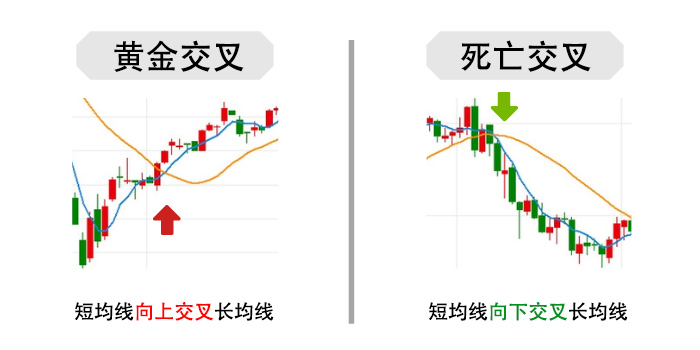
- Golden Cross: A short-term MA crosses above a long-term MA, typically signaling the start of an uptrend.
- Death Cross: A short-term MA crosses below a long-term MA, typically signaling the start of a downtrend.
- MA Alignment: In a bullish alignment, MAs are arranged from short-term to long-term top to bottom; the opposite is true for a bearish alignment.
Parameter Setting Suggestions:
For the cryptocurrency market, commonly used MA combinations include:
Short-term: 7-day and 21-day MAs
Medium-term: 50-day and 60-day MAs
Long-term: 120-day and 200-day MAs
Different timeframes should use different parameter combinations. For daily charts, focus on the 50-day and 200-day MAs. The crypto market moves fast, so shorter-period MA combinations are often needed compared to traditional stock markets to maintain sensitivity.
4. Volume: The Fuel of Trends
Volume is a crucial indicator for confirming the validity of a trend. Price can be manipulated, but volume often reflects the true level of market participation. Understanding the relationship between price and volume is an indispensable part of trend analysis.
Characteristics of a Healthy Price-Volume Relationship:
In an Uptrend: Volume increases when price rises and decreases during pullbacks.
In a Downtrend: Volume increases when price falls and decreases during rallies.
Warning Signals: Price rising on decreasing volume or price falling on increasing volume can signal a potential trend reversal.
Key Volume Signals:
Breakout on High Volume: A price breakout above a key resistance level accompanied by high volume confirms the breakout's validity.
Consolidation on Low Volume: Normal pullbacks within a trend are often accompanied by shrinking volume.
Abnormal Volume Spike: A sudden surge in volume often indicates an important turning point.
Volume is the fuel of trends; a trend without volume support is often unsustainable.
5. Technical Indicators for Assistance: Introduction to MACD and RSI
The MACD indicator is a powerful tool for judging trend momentum. It consists of the fast line (DIF), slow line (DEA), and histogram, effectively capturing the beginning and exhaustion phases of a trend. When the MACD line diverges from price, it often signals a potential trend reversal.
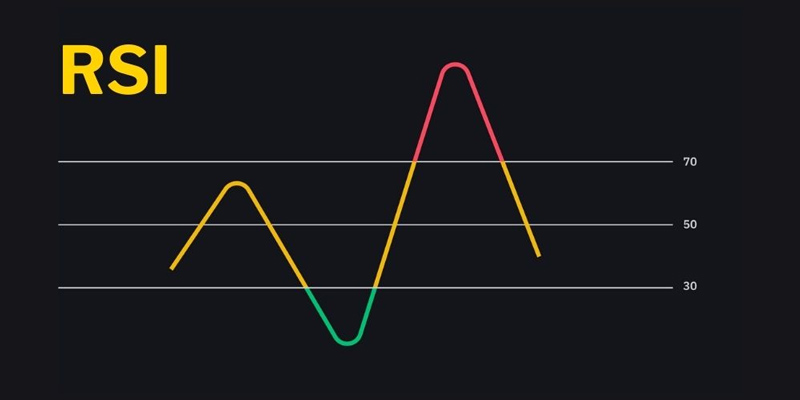
The RSI indicator measures overbought and oversold conditions in the market:
- RSI above 70: The market may be overheated, suggesting a risk of a pullback.
- RSI below 30: The market may be oversold, suggesting a potential for a bounce.
- RSI in a Trend: During a strong trend, the RSI can remain in extreme territory for extended periods.
Principles for Using Indicators:
Technical indicators should be used as confirmation tools, not as the sole basis for decisions. When price action, volume, and technical indicators all send a converging signal, the reliability of that signal is greatly enhanced.
Beyond MACD and RSI, you can further learn about Bollinger Bands, ADX, and other trend strength indicators later on.
A leading global cryptocurrency platform,suitable for both beginners and experienced traders.
New user benefit: 20% off trading fees upon registration!!
6. Trend Reversal Signals: How to Identify a "Change in Wind Direction"
Price patterns are important tools for identifying trend reversals. The Head and Shoulders top/bottom is one of the most classic reversal patterns, typically appearing at the end of a trend. Double top/double bottom patterns are also common reversal signals, and a break of the neckline holds significant reference value.
Other Important Reversal Signals:
- Wedge Patterns: Often appear near the end of a trend, and a breakout often leads to a significant move.
- Triangle Consolidation: The direction of the breakout from a converging triangle often indicates the direction of the next trend.
- Island Reversal: A relatively rare but strong reversal signal.
The Importance of Confirmation Signals:
A single reversal signal is not sufficient to make a trading decision; you need to wait for price confirmation. For example, a Head and Shoulders top pattern needs confirmation via an effective break of the neckline.
Risk Warning: The appearance of a reversal signal does not guarantee the trend will end. Traders should wait for confirmation signals and combine them with volume and trend lines for a comprehensive judgment.
7. Combining Timeframes: Differences Between Short-term and Long-term Trends
Multi-timeframe analysis is an essential skill for professional traders. The long-term trend determines the trading direction, the intermediate trend provides trading opportunities, and the short-term trend helps find specific entry points. This top-down analysis method can improve trading win rates.
Suggested Timeframe Combinations:
- Long-term Investors: Use monthly charts for direction, weekly charts for positioning, and daily charts for timing.
- Swing Traders: Use weekly charts for direction, daily charts for positioning, and 4-hour charts for timing.
- Day Traders: Use daily charts for direction, 4-hour charts for positioning, and 15-minute charts for timing.
Principle of Timeframe Coordination:
When the trend direction across different timeframes aligns, the reliability of the signal is highest. If trends across timeframes contradict each other, it's wise to trade cautiously or stay on the sidelines.
Remember: Trends always begin to germinate on the short-term timeframe, but their ultimate direction is determined by the long-term timeframe.
8. Common Mistakes and Mindset Reminders
Common analysis mistakes for beginners:
- Over-optimizing Indicators: Constantly adjusting parameters until they fit your preconceived expectations.
- Ignoring Price Action: Focusing too much on indicators while neglecting the most fundamental price behavior.
- Replacing Analysis with Prediction: Letting your own expectations override objective market signals.
- Frequently Switching Timeframes: Jumping between different timeframes to find evidence supporting your own views.
The Right Analytical Mindset:
Trend analysis is essentially a game of probabilities; there is no 100% accurate predictive tool. The key is to establish a complete analytical framework and maintain objectivity and consistency in your analysis. When the market proves your judgment wrong, have the courage to admit it and adjust promptly. The goal of trend analysis is not "prediction," but "going with the flow"—seeking high-probability directions amidst uncertainty.
A leading global cryptocurrency platform,suitable for both beginners and experienced traders.
New user benefit: 20% off trading fees upon registration!!
9. Conclusion: Learning to Follow the Trend is the Core Wisdom of Trading
Mastering trend analysis is just the beginning of trading. True trading experts not only know how to identify trends but also how to adopt corresponding trading strategies within different trends. Trend analysis is just the starting point of a trading system. Next, you need to combine it with risk control, position management, and psychological discipline to truly achieve consistent profitability.
The Importance of Continuous Learning and Practice:
Markets are constantly changing, and analytical methods need to evolve as well. It is recommended that traders maintain a learning mindset, continuously summarize and refine their analytical framework through practice. Record the analysis basis and results of every trade, and conduct regular reviews—this is the best way to improve your analytical skills.
Next Steps for Learning:
Based on mastering trend analysis, you can further learn advanced topics like candlestick patterns, market structure, and capital flow analysis, gradually building your own trading edge.
Recommended Further Reading:
"How to Read Cryptocurrency Charts: A Complete Guide to Candlestick Patterns"
