
How to Read Crypto Charts: A Complete Guide to Candlestick Patterns
Have you ever been puzzled why the market turns down right after you buy, only to rebound strongly once you sell? The key often lies in misinterpreting critical candlestick signals. Truly effective trading begins with a deep understanding of the chart itself. Today, we will focus on candlestick patterns that offer high-probability predictive value in actual trading, clarify their applicable market environments and specific functions, and provide you with a clear analytical roadmap.
![]()
The world's largest cryptocurrency exchange by trading volume,leading in security and liquidity.
New user benefit: Enjoy 20% off trading fees upon registration!
1. Left-Side Position Management
- 1) Don't use all your ammunition at once; buy in batches!!!
- 2) Divide your capital into portions. When unsure of the bottom, buying in batches is the most suitable method to average down your cost!!!
- 3) Adjust bottom-fishing based on market conditions flexibly. Don't add to positions too frequently, as it can be counterproductive for averaging down the coin price. An initial entry of 20%, 30%, 50% is suitable for aggressive investors keen on bottom-fishing!!!
- 4) Start with a small initial capital. If the coin price doesn't rise and continues to fall, gradually increase positions later, with the proportion of additions growing larger, thereby lowering the average cost. This method has lower initial risk; the steeper the funnel, the more substantial the potential profit!!
2. Right-Side Position Management
- 1) Buy 1: When the 5-day moving average crosses above the 10-day moving average, add 30% position!!
- 2) Buy 2: When the coin price effectively breaks through the life line and retests it successfully, add another 30% position, ensuring the total position reaches 60% at the beginning of the uptrend!
- 3) Buy 3: When it breaks through the neckline or other significant resistance levels and retests them successfully, confirming the reversal and upward pattern, add another 20% position. Total position should reach 80%, hold the coin for the rise!!
- 4) Buy 4: When the coin price above the life line shows a golden cross of the 5-day and 10-day moving averages again, it is a typical signal of accelerating upward momentum. At this point, promptly buy the remaining 20% position to maximize profits!!!
In daily trading, we often encounter phrases like "a top has formed," "a bottom has broken," or "entering consolidation." These all refer to candlestick patterns.
To master technical analysis, learning candlestick patterns is essential, and you must become proficient.
In this article, we will explain all aspects of candlestick patterns clearly, including their uses, classifications, and the specific applications of several key patterns. Reading this article should be sufficient for learning candlestick patterns.
1. T-Shape Line (Dragonfly)
Application Rules:
A reversal line indicating a bullish view at the bottom and a bearish view at the top.
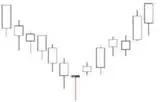
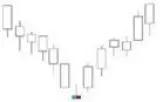
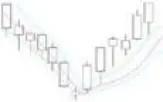
2. V-Shape Reversal
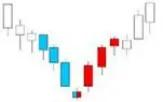
Application Rules:
Bottom formation, reversal to the upside.
3. Long Upper Shadow
Application Rules:
1. A long upper shadow appearing at a high level in an uptrend, especially with increased volume, suggests aggressive buying but heavy selling pressure at highs, making upward movement difficult and likely leading to a pullback or reversal.
2. A long upper shadow appearing at a low level in a downtrend, especially with increased volume, indicates bottom-fishing buying pressure that cannot effectively curb selling pressure, with bulls and bears gradually becoming evenly matched.
![]()
The world's largest cryptocurrency exchange by trading volume,leading in security and liquidity.
New user benefit: Enjoy 20% off trading fees upon registration!
4. Long Doji
Application Rules:
1. A doji can constitute an important warning signal, indicating a pause or reversal of the original trend.
2. A doji is only significant in markets where it does not appear frequently.
3. A doji with a very long upper shadow or a very long lower shadow indicates greater market indecision and has stronger predictive significance for a trend pause or reversal compared to a regular doji. Bottom formation, reversal to the upside.
5. Long Lower Shadow
Application Rules:
1. A long lower shadow appearing at a high level in an uptrend, especially with increased volume, suggests increasing selling pressure but active buying, yet with a sense of bullish exhaustion.
2. A long lower shadow appearing at a low level in a downtrend, especially with increased volume, indicates panic selling but strong buying at lows, with significant bottom-fishing buying pressure.
6. Lotus Emerging from Water
Application Rules:
A large bullish candle piercing through three moving averages, changing them to a bullish alignment, indicating a bullish outlook.
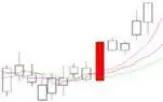
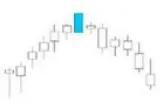
7. Large Bullish Candle
Application Rules:
1. A large bullish candle appearing in an uptrend signifies a sharp upward surge.
2. A large bullish candle appearing in a downtrend signifies a sharp upward rebound.
![]()
The world's largest cryptocurrency exchange by trading volume,leading in security and liquidity.
New user benefit: Enjoy 20% off trading fees upon registration!
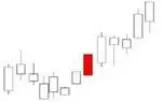
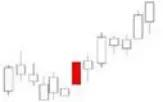
8. Large Bearish Candle
Application Rules:
1. A large bearish candle appearing in an uptrend signifies a deep downward pullback.
2. A large bearish candle appearing in a downtrend signifies an accelerated and severe decline.
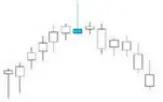
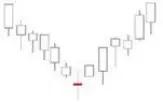
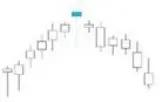
9. Inverted V-Shape Reversal
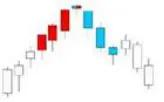
Application Rules:
Reversal pattern, bearish outlook.
10. Inverted Hammer
Application Rules:
If an inverted hammer appears after a downtrend, it forms a bullish candlestick pattern, similar to a regular hammer. When analyzing an inverted hammer, it is crucial to wait for a bullish confirmation signal in the next time period. This confirmation could take the form of the next day's opening price gapping up above the inverted hammer's real body. The larger the gap up, the stronger the confirmation signal. Alternatively, if the next day is a white candlestick with prices consistently at higher levels, it completes the bullish confirmation signal.
11. Hanging Man
Application Rules:
1. If a hanging man appears after an uptrend, it forms a bearish candlestick pattern.
2. When analyzing a hanging man, it is crucial to wait for a bearish confirmation signal in the next time period. The larger the gap down in the next day's opening price, the stronger the confirmation signal.
3. Alternatively, if the next day is a black candlestick with a closing price lower than the hanging man's real body, it completes the bearish confirmation signal.
![]()
The world's largest cryptocurrency exchange by trading volume,leading in security and liquidity.
New user benefit: Enjoy 20% off trading fees upon registration!
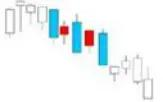
12. Stacked Bullish Cannons
Application Rules:
Stacked bullish cannons indicate an extremely bullish outlook.
13. Stacked Bearish Cannons
Application Rules:
Repetition of bearish cannons suggests a high probability of a short-term downward move.
14. Top Cross
Application Rules:
Short-term top, bearish outlook.
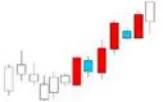
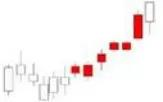
15. Eastern Red Sun Rising

Application Rules:
Consecutive bullish candles, especially if accompanied by a golden cross of moving averages, indicate a bullish outlook.
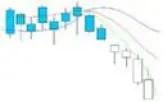
16. Guillotine
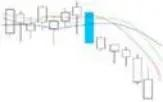
Application Rules:
A large bearish candle cutting through three moving averages, changing their alignment to bearish, indicates a bearish outlook.
17. Bullish Cannons
Application Rules:
Bullish strength, short-term bullish outlook.
![]()
The world's largest cryptocurrency exchange by trading volume,leading in security and liquidity.
New user benefit: Enjoy 20% off trading fees upon registration!
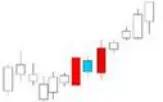
18. Morning Star (Counterattack Lines)
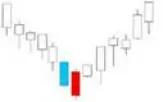
Application Rules:
1. A counterattack pattern appearing in a downtrend that transitions from a slow decline to a sharp decline suggests the market may evolve into a V-shaped reversal or a sideways consolidation.
2. The strength of the counterattack depends on how deeply the subsequent bullish candle penetrates the previous bearish candle's real body. The deeper the penetration, the higher the likelihood of a reversal or consolidation.
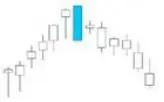
19. Bullish Marubozu
Application Rules:
A bullish marubozu indicates aggressive upward momentum by bulls. The strength depends on the size of the real body.
20. Bearish Marubozu
Application Rules:
A bearish marubozu indicates resolute selling pressure by bears. The strength depends on the size of the real body.
21. Evening Doji Star
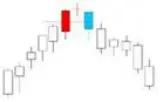
Application Rules:
1. The judgment rules for the evening doji star are the same as for the evening star.
2. The evening doji star has stronger predictive significance for a trend pause or reversal compared to the evening star.
22. Evening Star
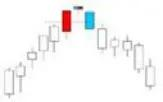
Application Rules:
The key to this pattern is the depth to which the third day's black real body penetrates the first day's white real body.
Below are some reference factors that, if present in an evening star pattern, increase the likelihood of it being a reversal signal. These factors include:
- (1) Price gaps between the first candle's real body and the star's real body, and between the star's real body and the third candle's real body;
- (2) The third candle's closing price deeply penetrates the first candle's real body (generally more than 50%);
- (3) Light trading volume on the first candle and heavy trading volume on the third candle.
![]()
The world's largest cryptocurrency exchange by trading volume,leading in security and liquidity.
New user benefit: Enjoy 20% off trading fees upon registration!
23. Golden Spider
Application Rules:
Golden cross of long-term, medium-term, and short-term moving averages, bullish outlook.
24. Nine Yin White Bone Claw
Application Rules:
Consecutive bearish candles appearing together with a death cross of moving averages suggests an ominous outlook for the subsequent trend.
25. Surge Side-by-Side White Lines
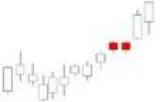
Application Rules:
Surge side-by-side white lines (parallel bullish candles) -- also known as "parallel bullish candlestick pattern, two bullish candles with a gap and flat bottom."
This pattern consists of two adjacent bullish candles with the same opening price and roughly equal real body heights.
In an uptrend, a set of upward-gapping parallel bullish candles forms a bullish continuation pattern.
Next, let's share a set of practical trading strategies.
![]()
The world's largest cryptocurrency exchange by trading volume,leading in security and liquidity.
New user benefit: Enjoy 20% off trading fees upon registration!
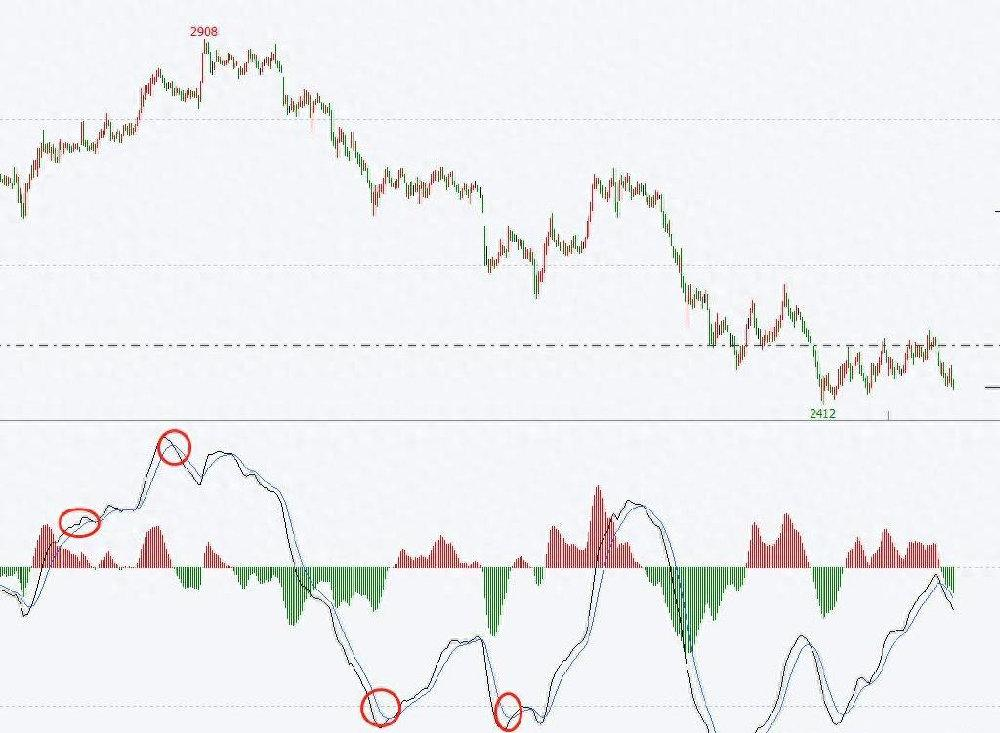
Market Implications
1. Market Implications of Dual Moving Averages
1. Position Implications
Dual lines above the 0 line indicate a bullish trend, while below the 0 line indicates a bearish trend;
The crossing above or below the 0 line by the dual lines serves as the basis for judging the overall market trend.

Cryptocurrency for Beginners