
How to Read Multi-Timeframes? The Sandwich Rule for Beginners
Have you ever encountered this situation: you see a perfect buy signal on the 1-hour chart, but the moment you enter the market, it reverses, trapping you instantly? This is often not because the signal itself was wrong, but because you were looking from the wrong "perspective."
Trading based on a single timeframe is like looking at a landscape through a magnifying glass—you can see the texture of the leaves clearly, but you don't realize you're standing on the edge of a cliff. Market prices are formed by the superposition of trends at different levels. Multi-timeframe analysis helps you see the "forest (major trend), the trees (medium-term structure), and the leaves (micro signals)" simultaneously, significantly improving your trading win rate and stability.
A leading global cryptocurrency platform,suitable for both beginners and experienced traders.
New user benefit: 20% off trading fees upon registration!!
The Sandwich Rule is a multi-timeframe analysis method designed specifically for beginners, easy to understand and execute. It helps you quickly build a clear, three-dimensional trading decision framework.
1. How to Use Multi-Timeframe Analysis? Larger Timeframes Set the Direction, Smaller Timeframes Find the Signal
Before we start, we must understand the different roles of various timeframes in trading:
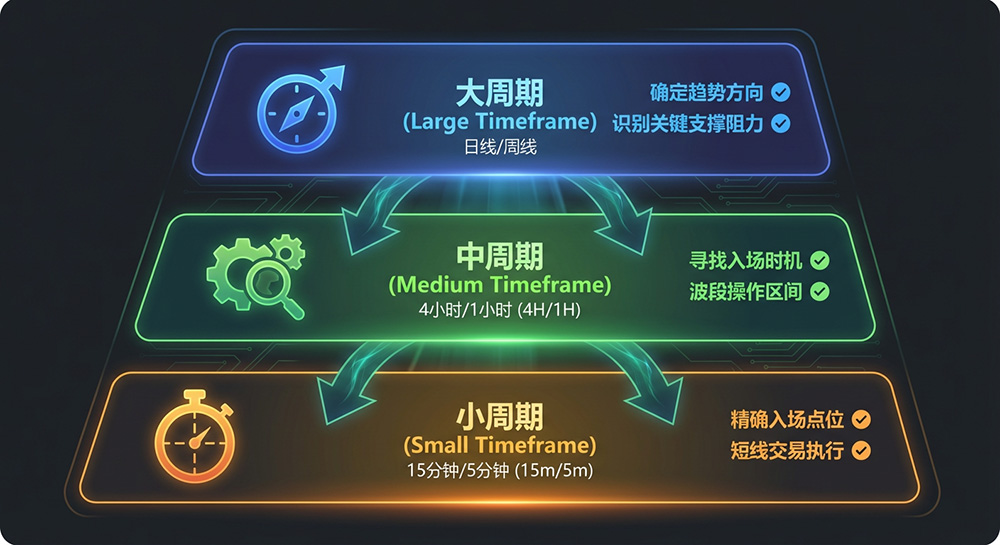
- Larger Timeframes (e.g., Daily, 4-hour): Determine the direction. They tell us whether the market's main force is moving up, down, or sideways. This is our strategic map.
- Medium Timeframes (e.g., 1-hour): Identify the structure. They show how the major trend is unfolding, helping us find key support/resistance levels and retracement rhythms. This is our tactical route.
- Smaller Timeframes (e.g., 15-minute, 5-minute): Find entry points. They provide precise buy/sell signals and locations for setting stop-loss and take-profit levels. This is our specific execution.
Most Common Beginner Mistakes:
Focusing only on smaller timeframes: Obsessing over micro-fluctuations on 1-minute or 5-minute charts, getting repeatedly fooled by market "noise," and losing sight of the major trend.
Looking only at larger timeframes: Although the direction is correct, the entry timing is crude, leading to overly large stop-losses or getting trapped immediately upon entry, affecting your mindset.
2. What is the Sandwich Rule? Why is it Easiest for Beginners to Understand?
After understanding the roles of different timeframes, we need a practical, executable framework to combine them—this is the "Sandwich Rule."
The Sandwich Rule, as the name suggests, is like making a sandwich: layering different analytical timeframes on top of each other to form a complete, healthy "trading meal."
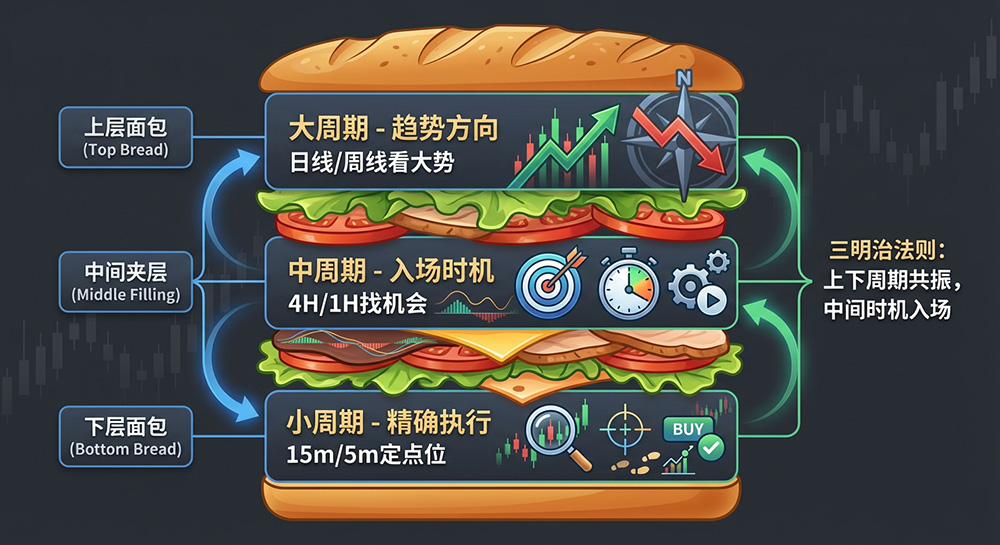
Top Bread: Larger Timeframe (Sets Direction)
This is the base of the sandwich, determining the overall flavor and nutrition. We use it to judge the market's primary trend.
Middle Layer: Medium Timeframe (Finds Structure)
This is the core filling (meat, vegetables) of the sandwich, providing the main flavor and substance. We use it to find key support/resistance areas and the end points of retracements.
Bottom Bread: Smaller Timeframe (Finds Signals)
This is the other slice of bread, making the whole structure complete and stable. We use it to find precise entry and stop-loss points.
A complete trading chain is as follows:
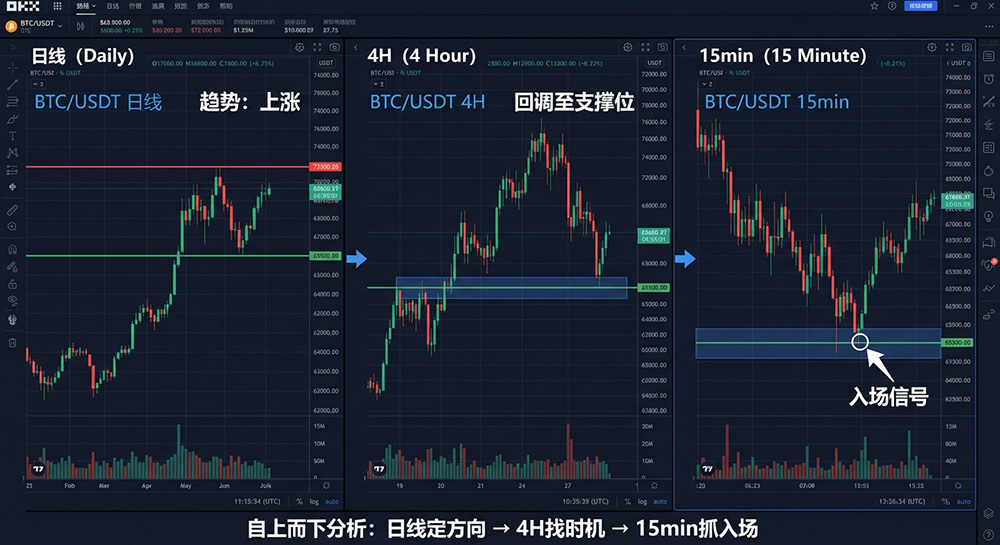
Daily (Uptrend) → 1-hour Chart (Pullback to Key Support) → 15-minute Chart (Bullish Engulfing Pattern Appears) = High Probability Long Opportunity
3. How Can Beginners Apply the Sandwich Rule? (Step-by-Step)
Step 1: Look at the Larger Timeframe First – Determine Trend Direction
Open the daily chart and ask yourself: Is the current primary trend up, down, or sideways?
Golden Rule: If the direction of the larger timeframe trend hasn't changed, most counter-trend signals appearing on smaller timeframes are unreliable. In a daily uptrend, we only look for long opportunities; in a downtrend, only for short opportunities.
After clarifying the major direction, we can then look for the structure and key levels of the trend's movement on the medium timeframe.
A leading global cryptocurrency platform,suitable for both beginners and experienced traders.
New user benefit: 20% off trading fees upon registration!!
Step 2: Then Look at the Medium Timeframe – Identify Key Levels and Structure
Switch to the 1-hour or 4-hour chart. Within the major trend direction determined in Step 1, look for the following information:
- Support/Resistance Levels: Which key support has the price pulled back to? Or which key resistance has it bounced to?
- Price Structure: Is it forming higher highs and higher lows (uptrend)? Or lower highs and lower lows (downtrend)?
- Bull/Bear Strength: Is the pullback a strong sideways consolidation or a deep decline? This represents the strength of the bulls.
Once key levels are confirmed, the smaller timeframe is used for execution, avoiding blind waiting or premature entry.
Step 3: Finally Look at the Smaller Timeframe – Find Entry and Stop-Loss Points
Finally, move to the 15-minute or 5-minute chart. Now, your task is execution:
- Entry Signal: Wait for a clear candlestick reversal pattern (e.g., hammer, engulfing pattern), indicator divergence, or other signals at the key level identified on the medium timeframe.
- Set Stop-Loss: Place the stop-loss outside the key structure. For example, when going long at a support level, place the stop a reasonable distance below that support.
- Set Take-Profit: Estimate a reasonable risk-reward ratio based on the next resistance level on the medium timeframe.
4. What is the Difference Between the Sandwich Rule and Single Timeframe Analysis? How Does It Improve Trend Reversal Identification?
Single Timeframe Perspective: On the 1-hour chart, after a continuous price decline, a large bullish candle appears. You might think it's a "bottom reversal" and rush to buy the dip. But this could just be a normal bounce within a downtrend.
Sandwich Perspective:
Check Daily: The trend is still clearly down, with no reversal structure.
Conclusion: This large bullish candle on the 1-hour chart is likely just "ineffective noise." You should abandon this "buying the dip" opportunity.
The Sandwich Rule helps you filter out at least 70% of false signals, preventing you from overtrading against the trend.
5. Common Mistakes & How to Avoid Them
Mistake 1: Smaller Timeframe Signal Conflicts with Larger Timeframe Direction
Behavior: The daily chart is in a downtrend, but you chase a long position during a bounce on the 15-minute chart.
Correction: Always follow the larger timeframe and trade against the smaller timeframe. That is, when the major trend is down, only look for short signals during bounces on the smaller timeframe.
Mistake 2: Trying to Find Entry Points on Every Timeframe (Timeframe Conflict)
Behavior: You want to swing trade based on the daily, scalp based on the 1-hour, and day trade based on the 5-minute, resulting in confused thinking.
Correction: Fix your trading style and timeframe combination. If you are a swing trader, lock in the "Daily-4H-1H" combination and don't let smaller timeframe fluctuations distract you.
Mistake 3: Ignoring Volume
Behavior: You see the key level and candlestick signal but ignore volume confirmation.
Correction: Breakouts of key levels should have high volume; pullbacks to key levels can have low volume. Volume is the "lie detector" that verifies the authenticity of signals.
Mistake 4: Jumping Timeframes Too Quickly
Behavior: Jumping directly from the daily chart to the 1-minute chart to find an entry, skipping the crucial structural analysis layer.
Correction: Follow the principle of gradual progression. Do not skip the medium timeframe, the "filling layer."
Most of these mistakes stem from "timeframe confusion." Using the Sandwich Rule keeps the entire process consistent.
A leading global cryptocurrency platform,suitable for both beginners and experienced traders.
New user benefit: 20% off trading fees upon registration!!
6. Practical Example: Running a Complete Process Using the Sandwich Rule
Let's take considering going long on BTC (Bitcoin) as an example:
Larger Timeframe (Daily) Analysis:
Check the BTC/USDT daily chart. The price is in a clear upward channel, and the MA60 is sloping upwards.
Conclusion: The primary trend is up. Strategic direction – only look for long opportunities.
Medium Timeframe (4-hour) Analysis:
Switch to the 4-hour chart. The price is pulling back from a high and is currently approaching the confluence of a previous support platform and an upward trendline.
Conclusion: Found a key bullish defense zone. Tactically, wait for a stabilization signal in this area.
Smaller Timeframe (15-minute) Analysis:
Finally, open the 15-minute chart. Observe that the price has formed several candles with long lower wicks consecutively in the key support zone, followed by a "bullish engulfing" pattern with a noticeable increase in volume.
Conclusion: A precise entry signal has appeared.
Execution:
- Entry: Enter a long position after the bullish engulfing pattern forms.
- Stop-Loss: Place it a certain distance below the support zone and the upward trendline.
- Take-Profit: Target the first major resistance level above, ensuring a risk-reward ratio of at least 1:1.5.
7. Conclusion: Why is Multi-Timeframe Analysis a Required Beginner Course?
Trading success relies on integrating the three elements: "Trend, Structure, and Signal." The Sandwich Rule transforms this concept into a simple, stable, repeatable process. Multi-timeframe analysis is key for beginners to improve their win rate, and the Sandwich Rule is the easiest entry-level framework to execute.
It forces you to think from the macro to the micro, making every trade you take logical and well-founded. For a beginner, mastering the Sandwich Rule means you have started to break free from the slavery of emotions and are on the path to systematic trading. This is the starting point for moving from losses to consistent profitability.
