
How to Gauge Market Sentiment Through On-Chain Data?
In the 24/7 global cryptocurrency market, every participant is searching for a "crystal ball" to foresee opportunities. On-chain data is the "codebook" this seemingly chaotic market leaves for us. Every transaction and every address activity silently reveals the true emotions of market participants.
A leading global cryptocurrency platform,suitable for both beginners and experienced traders.
New user benefit: 20% off trading fees upon registration!!
1. Blockchain: The Market's "Emotion Diary"
Unlike traditional financial markets, blockchain's transparency allows us to observe every move of each address in real-time. This transparency is like installing a real-time monitor for market sentiment. When the market becomes frenzied, on-chain data will flash warnings first; when panic spreads, on-chain activity will also show early signs.
Remember the eve of the LUNA crash in 2022? On-chain data had already shown abnormal large-amount transfer activity. Investors who read these signals early successfully avoided the subsequent plunge. This is the value of on-chain data—it doesn't lie, it only faithfully records the true actions of every participant.
2. Reading the Market's "Emotion Indicators"
1. Active Addresses: The Market's Pulse
Imagine active addresses as foot traffic in a mall. On weekdays, the mall is quiet; on weekends, it's bustling. The blockchain network is the same. When Bitcoin's daily active addresses exceed 1 million, it often signals that market sentiment is heating up.
But this number needs to be viewed dialectically—if a sudden surge in activity is accompanied by stagnant prices, it may indicate "a peak before a decline."
2. Exchange Balances: An Investor Sentiment Barometer
Changes in exchange balances are like the demand deposits in our bank accounts. When people worry about market risk, they tend to keep tokens on exchanges for easy selling. Conversely, when confidence is high, they prefer to move assets to private wallets for long-term holding.
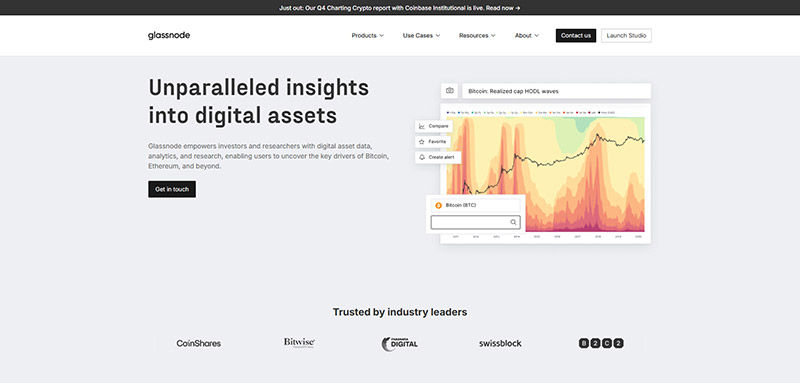
By observing Glassnode data, we can clearly see: In January 2023, when Bitcoin was hovering around $16,000, exchange balances saw a significant decline—a clear signal that market sentiment had bottomed out. Within the following six months, Bitcoin experienced a gain of over 100%.
3. Whale Movements: Traces of Smart Money
Large transactions by whales are like the position reports of Wall Street bigwigs. When they start moving large amounts of Bitcoin from exchanges to cold wallets, this is usually a positive long-term signal. Conversely, if there is a sustained inflow to exchanges, it may foreshadow selling pressure.
However, tracking whales requires skill. Some whale addresses belong to exchanges or custodial institutions, and their transfers don't represent market sentiment. Therefore, we need to use professional tools like Nansen, filtering out noise through label identification.
A leading global cryptocurrency platform,suitable for both beginners and experienced traders.
New user benefit: 20% off trading fees upon registration!!
Beyond these core indicators, to deeply understand changes in market sentiment, you also need professional sentiment analysis tools—they can transform complex on-chain data into easy-to-read signals.
3. Using Professional Sentiment Analysis Tools
The Fear & Greed Index: The Market's Thermometer
This classic indicator combines multiple dimensions like volatility, market momentum, social media hype, surveys, and Bitcoin dominance. When the index is below 25, the market is often in extreme fear, usually a good time to buy; when the index exceeds 75, it means the market is overheating and caution is needed.
NVT Ratio: The "P/E Ratio" of the Crypto Market
The NVT ratio can be understood as the "price-to-earnings ratio" of the blockchain network. When this ratio is too high, it suggests the network value might be overvalued and market sentiment overly optimistic. Conversely, it may indicate undervaluation. Historical data shows that when Bitcoin's NVT ratio exceeds 150, the market is often near a cyclical top.
4. From Data to Decision: A Practical Application Guide
Build Your Own Monitoring Dashboard
For novice investors, it's recommended to start with these core indicators to build your own monitoring system:
- Daily Active Addresses (DAA)
- Exchange Net Position Change
- Whale Transaction Count
- Fear & Greed Index
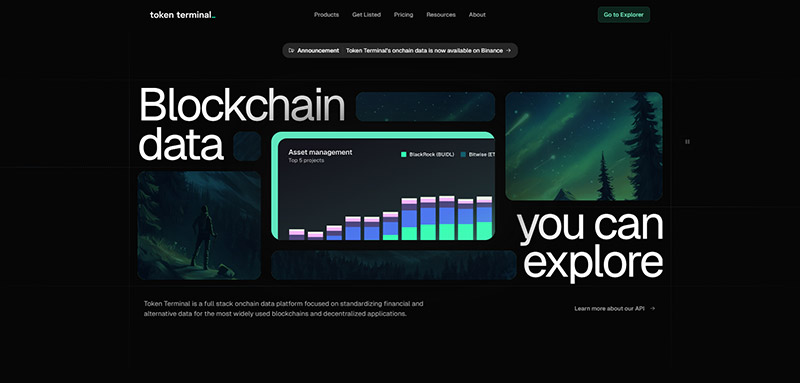
These indicators can be viewed for free on platforms like Glassnode and Token Terminal. The key is to maintain consistent observation, record the relationship between these indicators and price action, and gradually develop your own "data intuition." You can use a free Glassnode account to create a custom dashboard, set these indicators as favorites, and spend 5 minutes a day browsing the data to cultivate an intuition for market sentiment.
Cross-Validation with Technical Analysis
On-chain data needs to be combined with technical analysis to be most effective. For example, when a price tests a key support level, if it coincides with positive signals like declining exchange balances and whale accumulation, the reliability of that support level is greatly enhanced.
A leading global cryptocurrency platform,suitable for both beginners and experienced traders.
New user benefit: 20% off trading fees upon registration!!
Avoiding Common Pitfalls
It's important to be aware that on-chain data is not a silver bullet. It reflects what has already happened and has a certain lag. Furthermore, signals from a single indicator can be misleading and need to be corroborated by multiple indicators. Most importantly, on-chain data cannot predict black swan events, nor can it replace fundamental research on a project.
5. Conclusion: Finding the Market's "Heartbeat" in the Data
In this emotion-driven market, on-chain data is a crucial tool for maintaining rationality. It's like a compass—while it can't predict when a storm will hit, it ensures we don't lose our way during one.
Every good cryptocurrency investor should learn to listen to the stories on-chain data tells. When you can feel the market's temperature from cold numbers and identify emotional threads from complex transactions, you have truly mastered the art of surviving in this market.
Remember, the market will always fluctuate, and emotions will always swing between fear and greed. Only those who can navigate this ocean of data will ultimately reach the shores of wealth.
If you want to spot trends earlier before the next market move, why not start today? Open Glassnode or Nansen and observe those strings of blockchain data—it's quietly telling you the market's heartbeat.
