
How to Read Crypto Charts: A 2025 Beginner's Guide
In the highly volatile cryptocurrency market, price charts are the essential "navigation map" every trader must master. They are not just a record of price history but a visual representation of market sentiment, capital flow, and the tug-of-war between bulls and bears. For beginners, learning to interpret charts means understanding what the market is "saying," enabling more rational decisions rather than being driven by emotion. This article aims to help you systematically grasp the fundamentals of chart analysis—from understanding a single candlestick to recognizing trends and indicators, and ultimately identifying key trading signals.
A leading global cryptocurrency platform,suitable for both beginners and experienced traders.
New user benefit: 20% off trading fees upon registration!!
1. Basic Understanding: Components of a Cryptocurrency Chart
Before diving into analysis, you must understand the basic structure of a chart.
1. Timeframe: The timeframe options at the top of the chart (e.g., 1 minute, 1 hour, 4 hours, 1 day) determine the time range each data point covers.
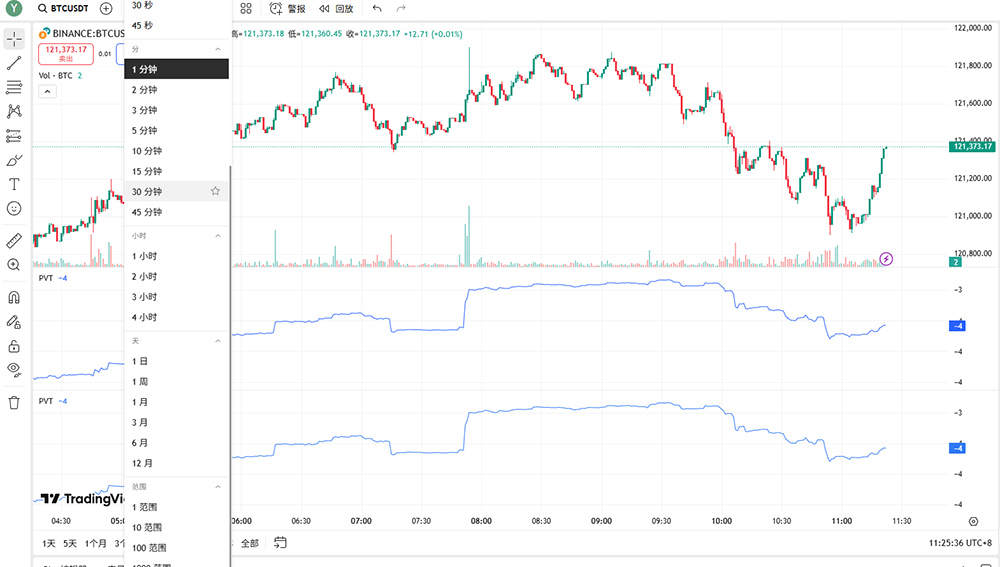
Short-term trading (e.g., day trading): Typically focuses on 1-minute to 4-hour charts to capture short-term fluctuations.
Long-term investing: Focuses on daily or weekly charts to grasp macro trends.
Core Principle: Analyze from larger to smaller timeframes—first check the daily chart for direction, then use the hourly chart to find entry points.
2. Price Axis and Volume:
The vertical axis of the chart represents price, and the horizontal axis represents time.
The volume bars at the bottom of the chart are crucial, representing the total trading volume within a specific period. A price increase accompanied by high volume usually indicates a healthy trend with strong momentum; conversely, it may signal weakening momentum.
2. Introduction to Candlestick Charts: The First Lesson in Market Language
Candlestick charts are the foundation of technical analysis, condensing rich information into individual "candles."
1. Components of a Candlestick:
Body: Represents the range between the opening and closing prices. If the closing price is higher than the opening price, it is typically green or white (bullish candle), indicating an upward move. Conversely, it is red or black (bearish candle), indicating a downward move.
Wicks/Shadows: The thin lines extending from the body. The top of the upper wick represents the highest price of the period, and the bottom of the lower wick represents the lowest price of the period.
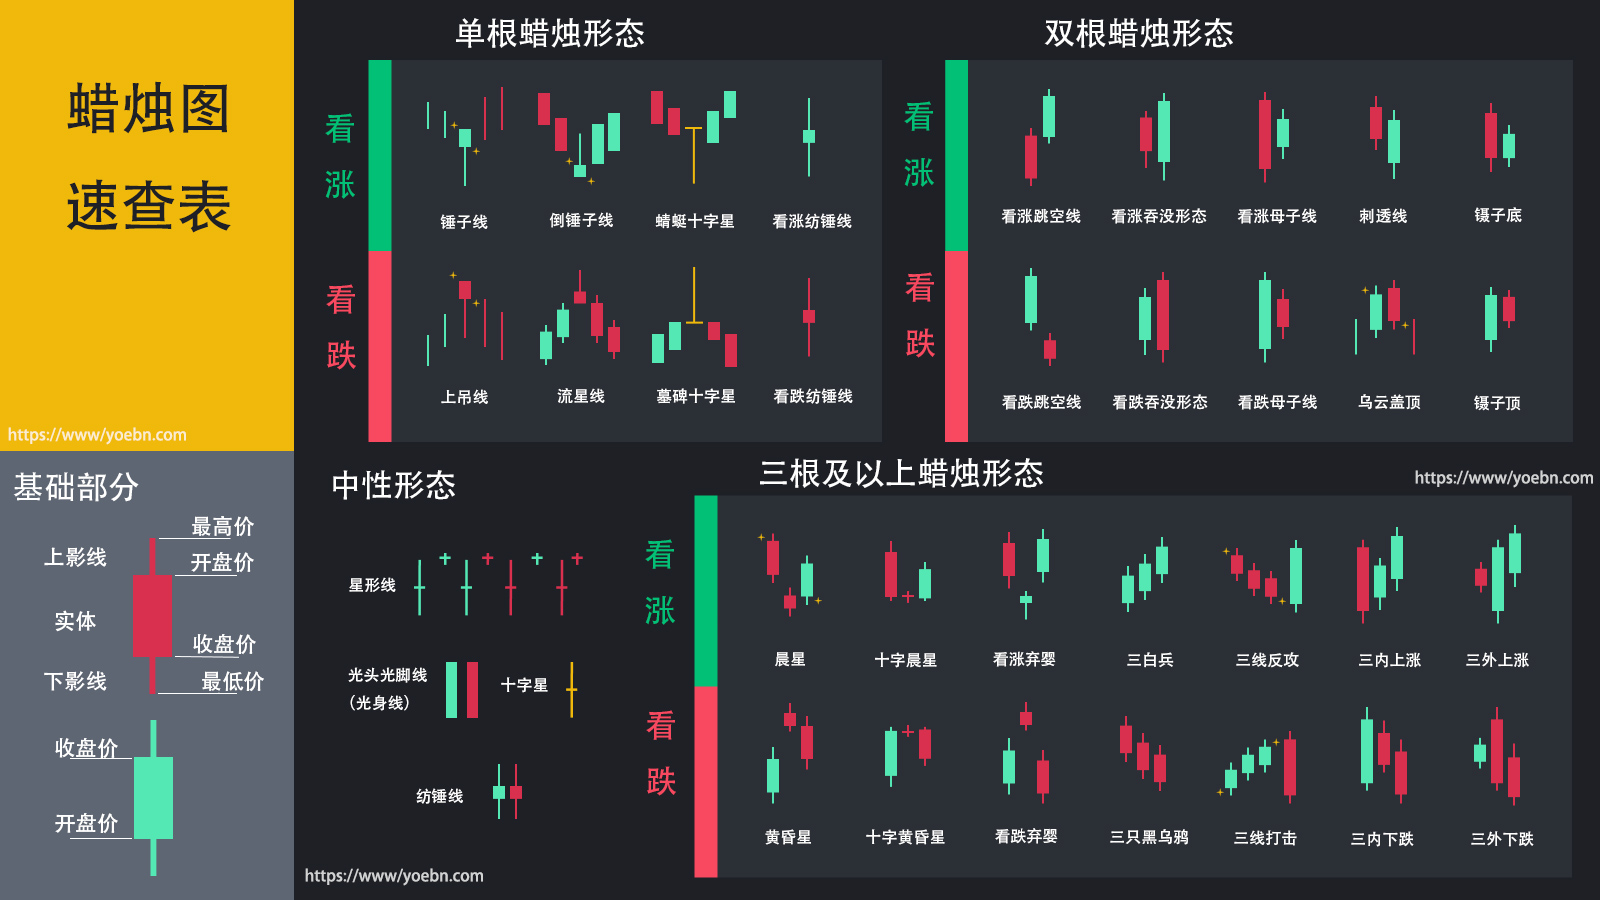
2. Key Candlestick Patterns:
Single Candle Patterns:
Hammer: Appears in a downtrend, with a long lower wick and a small body. It is a potential bullish reversal signal.
Shooting Star: Appears in an uptrend, with a long upper wick and a small body. It is a potential bearish reversal signal.
Combination Patterns:
Bullish Engulfing: After a downtrend, a large bullish candle completely "engulfs" the previous bearish candle. It is a strong bullish signal.
Bearish Engulfing: The opposite of the above, a bearish signal.
Morning Star: Composed of three candles (large bearish, small body, large bullish). It is a classic bottom reversal signal.
3. Trends and Support/Resistance: The Core of Determining Direction
Identifying trends is the foundation of profitable trading, while support and resistance are core concepts in trend analysis.
1. Drawing Trendlines:
Uptrend: Connecting successively higher lows forms a support line.
Downtrend: Connecting successively lower highs forms a resistance line.
Sideways/Range-bound: Price fluctuates between horizontal support and resistance levels.
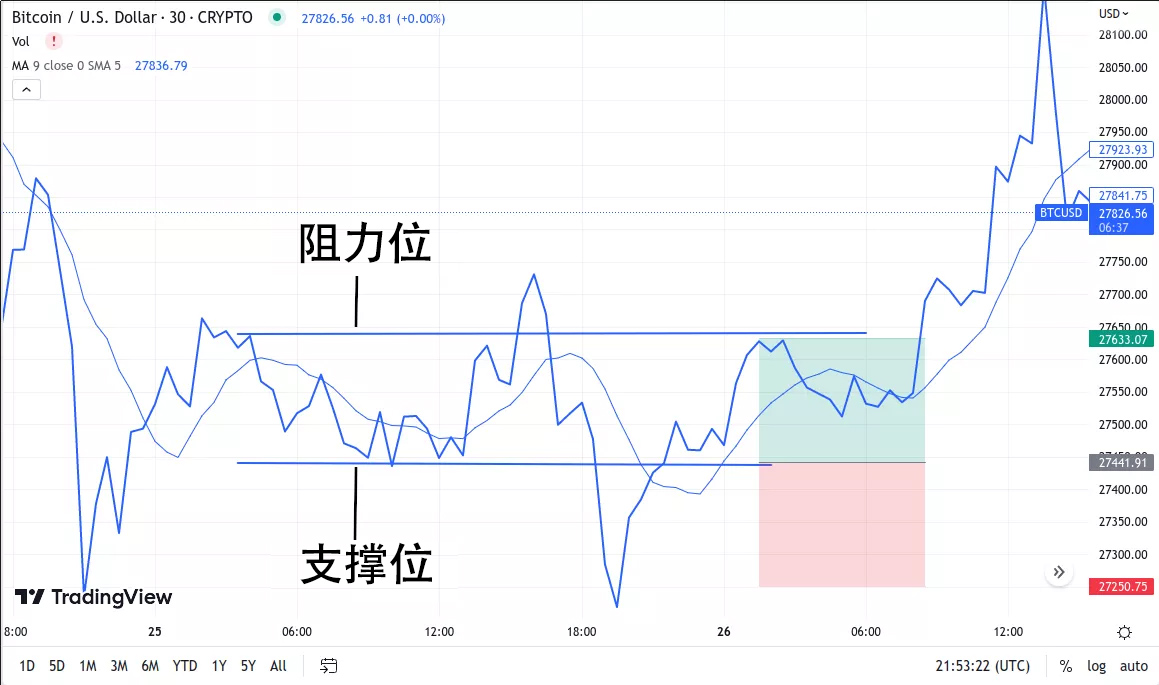
2. Support and Resistance:
Support: A price level where buying pressure is expected to emerge, potentially stopping a decline. Think of it as a "floor."
Resistance: A price level where selling pressure is expected to emerge, potentially stopping an advance. Think of it as a "ceiling."
Key Signal: When price breaks through a resistance level with strength, that resistance can turn into new support, and vice versa. A successful retest of the broken level is often an ideal entry point.
A leading global cryptocurrency platform,suitable for both beginners and experienced traders.
New user benefit: 20% off trading fees upon registration!!
4. Detailed Explanation of Common Technical Indicators
Technical indicators are secondary calculations based on price and volume using mathematical formulas, used to aid judgment.
1. Moving Averages (MA):
Definition: The average closing price over a past period. Common types are Simple Moving Average (SMA) and Exponential Moving Average (EMA), with EMA giving more weight to recent prices for faster responsiveness.
Golden Cross: A short-term MA (e.g., 20-day) crosses above a long-term MA (e.g., 50-day), considered a bullish signal.
Death Cross: A short-term MA crosses below a long-term MA, considered a bearish signal.
2. Relative Strength Index (RSI):
Function: Measures the speed and magnitude of price changes to determine if the market is "overbought" or "oversold."
Usage: An RSI above 70 suggests the market may be overheated (overbought), with a risk of a pullback. An RSI below 30 suggests the market may be oversold, with potential for a bounce.
Divergence: When price makes a higher high but RSI fails to do so (bearish divergence), it is a potential warning of a trend reversal.
3. MACD Indicator:
Components: Consists of the DIF line (fast line), DEA line (slow line), and a histogram.
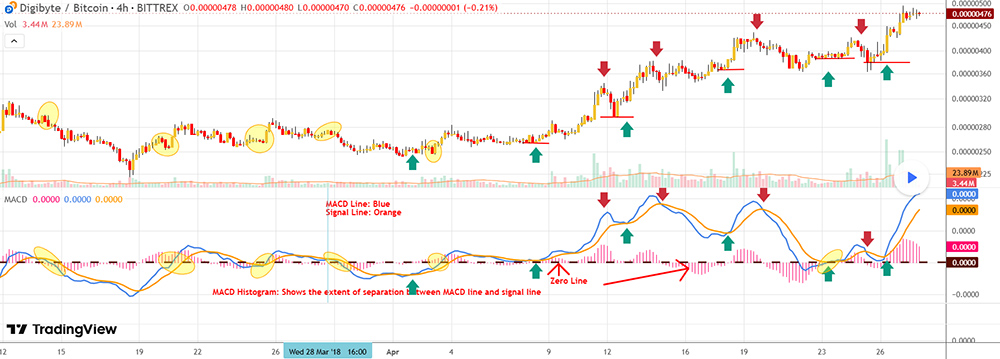
Usage:
A DIF line crossing above the DEA line (golden cross) is a buy signal.
A DIF line crossing below the DEA line (death cross) is a sell signal.
MACD above the zero line indicates a generally bullish trend; below the zero line indicates a bearish trend.
5. Chart Patterns: Visual Signals of Market Sentiment
Chart patterns are formations created by price movements over specific periods, suggesting potential trend continuation or reversal.
1. Reversal Patterns (Signal the end of the current trend):
Head and Shoulders Top: Appears at the end of an uptrend, resembling a head with two shoulders. It is a strong bearish reversal pattern.
Double Bottom (W-bottom): Appears at the end of a downtrend, resembling a "W". It is a strong bullish reversal pattern.
2. Continuation Patterns (Temporary pauses within a trend):
Flags / Triangles: Price consolidates in a narrow range after a sharp move. After the pattern completes, the price typically continues in the original trend direction.
Key Confirmation: A breakout from a pattern must be accompanied by increased volume; otherwise, it might be a false breakout.
A leading global cryptocurrency platform,suitable for both beginners and experienced traders.
New user benefit: 20% off trading fees upon registration!!
6. Multi-Timeframe Analysis: The Art of Zooming In and Out
Professional traders do not focus on just one timeframe.
Core Method:
Look at the larger timeframe for direction: First, determine the primary trend (up, down, or sideways) on the daily chart.
Look at the smaller timeframe for timing: Then, switch to the 4-hour or 1-hour chart to find specific entry points (e.g., pullbacks to support, bullish patterns) that align with the larger trend.
Example: If the BTC daily chart is in an uptrend, buying on the hourly chart when price pulls back to a trendline support or moving average support is a strategy with a favorable risk-reward ratio.
7. Trading Psychology and Chart Misconceptions
"Charts don't lie, but people can misinterpret them." Common psychological pitfalls for beginners include:
Confirmation Bias: Only looking for signals that support a preconceived idea while ignoring contradictory evidence.
Overtrading: Entering and exiting trades frequently without clear signals, incurring high fees.
FOMO (Fear Of Missing Out) and Panic Selling: Buying at highs due to FOMO or selling at lows due to fear.
Solution: Develop and strictly follow a trading plan with clear entry, stop-loss, and take-profit conditions.
8. Practical Case Study
Scenario: Analyzing the ETH/USDT 4-hour chart to find a long (buy) opportunity.
Identify Trend: Connect recent lows to draw a clear uptrend line, confirming the overall upward trend.
Mark Support/Resistance: Identify a key horizontal resistance level ahead (e.g., $3,800).
Add Indicators:
RSI recovers from below to near 50, showing strengthening momentum.
MACD shows a golden cross above the zero line.
Wait for Signal: Price pulls back to the uptrend line support and forms a bullish hammer candlestick pattern.
Create a Plan:
Entry: Enter after the hammer candle closes.
Stop-Loss: Place below the low of the hammer candle.
Take-Profit: Target the previous resistance level at $3,800.
A leading global cryptocurrency platform,suitable for both beginners and experienced traders.
New user benefit: 20% off trading fees upon registration!!
9. Summary and Next Steps
Mastering chart analysis is a continuous process of learning and practice. You have taken the crucial first step: understanding the basic building blocks of candlesticks, trends, support/resistance, technical indicators, and patterns.
Suggestions for further advancement:
Systematize: Integrate what you've learned to build your own trading system that includes risk management.
Deepen Learning: Study more complex patterns and indicators, and understand the market psychology behind them.
Continuous Review: Regularly review your trading journal to analyze the reasons for wins and losses.
Recommended Further Reading:
How to Build a Personal Crypto Trading System
Remember, always remain humble before the market, and risk management is always the top priority. Wishing you successful trading!
