
How to Learn Cryptocurrency Technical Analysis: A Beginner's Step-by-Step Guide
Watching cryptocurrency price charts go up and down, do you ever feel like you're reading a foreign language? In reality, these fluctuating lines and candlesticks are the market telling a story in a unique "chart language." Learning to interpret this language is the core of technical analysis. Whether you aim for short-term trading or long-term holding, mastering crypto technical analysis can help you make more rational trading decisions.
Technical analysis is a method of forecasting future price movements by studying historical price and volume data. Unlike fundamental analysis, which examines a project's background and team strength, technical analysis focuses on only one thing: the chart itself.
A leading global cryptocurrency platform,suitable for both beginners and experienced traders.
New user benefit: 20% off trading fees upon registration!!
For a highly volatile market like cryptocurrency, technical analysis can help you:
- Identify potential buying and selling opportunities.
- Manage trading risk.
- Understand the current market sentiment.
Mastering crypto technical analysis is also a necessary path for every trader who wants to survive long-term in the cryptocurrency market. This guide will serve as your beginner's roadmap, taking you step-by-step. Only through continuous practice and review can you truly grow from a novice into a technical analysis expert capable of independently analyzing market trends.
1. Core Principles of Technical Analysis: Visualizing Market Psychology
Before learning specific methods, understanding the logic behind them is more important than memorizing patterns.
- "Price Discounts Everything": Technical analysis believes that all known and unknown information (including news, sentiment, fundamentals) is already reflected in the current price.
- Price Moves in Trends: Once a price establishes a direction (up, down, or sideways), it tends to continue in that direction.
- History Repeats Itself: The collective psychology of the market (greed and fear) leads to similar chart patterns recurring over time.
Why is technical analysis more effective in the crypto market?
Because the crypto market is highly driven by the emotions of global investors and trades 24/7, generating vast amounts of data purely from buying and selling actions, providing a perfect environment for technical analysis.
2. First Step: Learning to Read Candlestick Charts
Candlestick charts are the alphabet of technical analysis, the first foreign language you must learn.
Structure: A single candlestick represents price movement over a specific period. It consists of a "body" and "wicks" (or shadows).
Body: The area between the opening and closing prices. If the closing price is higher than the opening price, it's typically green or white (bullish candle); otherwise, it's red or black (bearish candle).
Wicks: The thin lines extending from the body, representing the highest and lowest prices during that period.
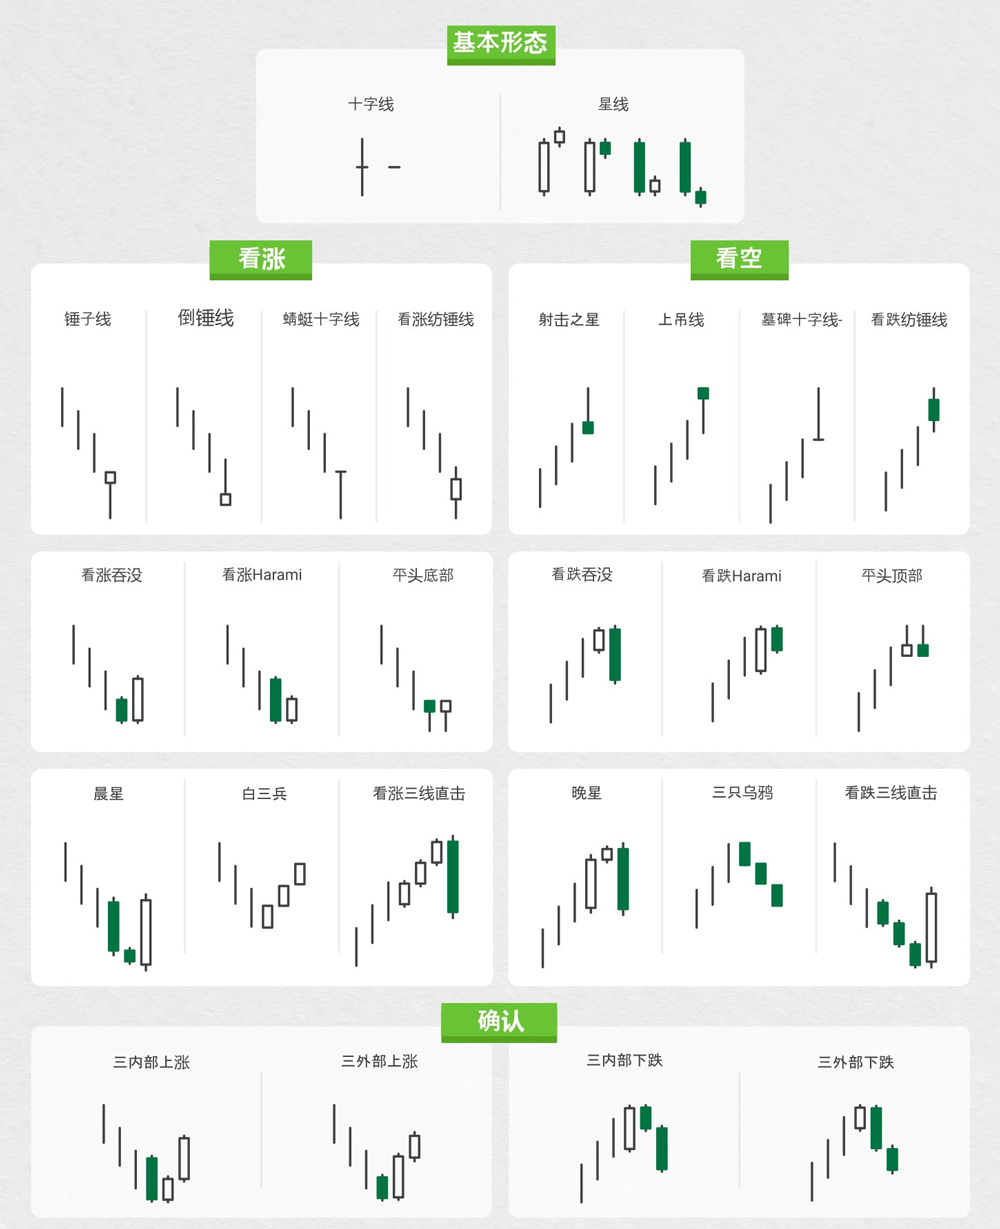
Basic Patterns and Sentiment:
Hammer: Appears in a downtrend. A long lower wick indicates that after sellers pushed the price down, buyers strongly pulled it back up, signaling a potential bullish reversal.
Engulfing Pattern: The body of the second candle completely "engulfs" the body of the first, suggesting a possible trend reversal.
Doji: A very small body indicates equilibrium between buyers and sellers, showing market indecision.
Summary: Start by learning to see the battle between bulls and bears behind single or two-candle combinations.
3. Second Step: Mastering Trends, Support, and Resistance
Now that you understand the words (candlesticks), it's time to learn the grammar (trends and structure).
Trendlines:
- Uptrend: Connecting successive higher lows forms an upward-sloping line.
- Downtrend: Connecting successive lower highs forms a downward-sloping line.
- Drawing: Connect at least two highs or lows. The more points a trendline touches, the more reliable it is.
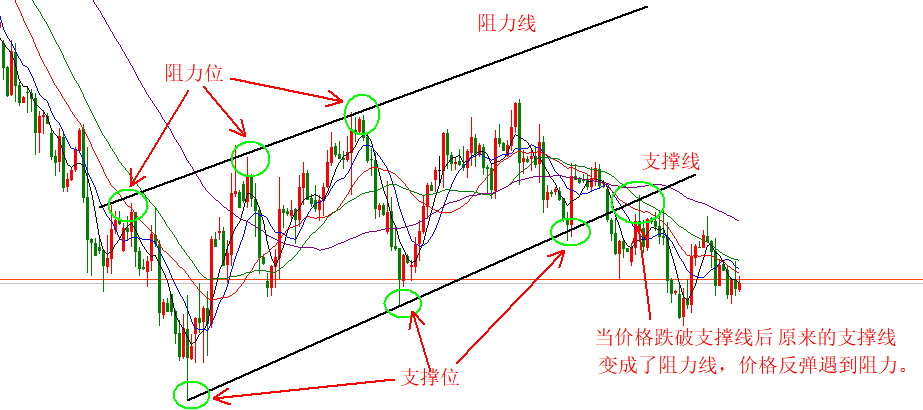
Support and Resistance:
- Support Level: A price level where buying interest is strong enough to halt or reverse a downtrend.
- Resistance Level: A price level where selling pressure is strong enough to halt or reverse an uptrend.
- Application: Look for buying opportunities near support levels and selling or reducing positions near resistance levels. When a support or resistance level is broken decisively, their roles may reverse.
A leading global cryptocurrency platform,suitable for both beginners and experienced traders.
New user benefit: 20% off trading fees upon registration!!
Practice Tip: Open TradingView, pick any cryptocurrency, and try drawing at least one uptrend line and one downtrend line on its historical chart.
4. Third Step: Understanding the Logic of Technical Indicators
Technical indicators are calculation tools based on mathematical formulas that help you analyze the market more objectively. But remember: don't let indicators think for you; they are just auxiliary signals.
- Moving Average (MA): Represents the average price over a past period, a basic tool for identifying trend direction. When the price is above the MA, it's often considered an uptrend.
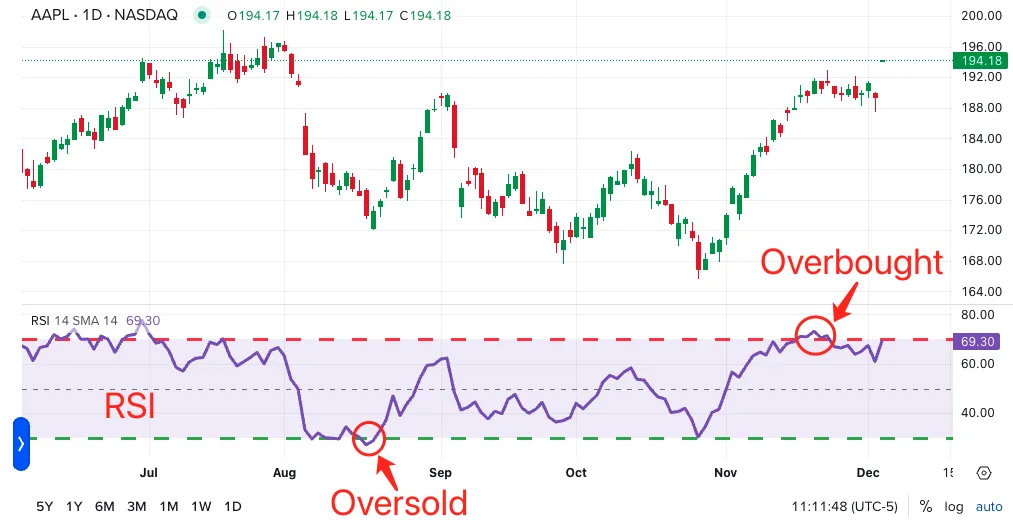
- Relative Strength Index (RSI): Oscillates between 0 and 100, measuring whether the market is "overbought" or "oversold." Typically, RSI above 70 indicates overbought (potential pullback), and below 30 indicates oversold (potential bounce).
- MACD: Consists of a fast line, a slow line, and a histogram, used to gauge trend momentum and direction. When the fast line crosses above the slow line, it's a "golden cross" (bullish signal); the opposite is a "death cross" (bearish signal).
- Bollinger Bands: Form a channel with three lines. The middle line is a moving average, and the upper and lower bands are standard deviations of price. When the price touches or breaks the upper band, it may be overbought; touching the lower band may indicate oversold. Narrowing bands often precede significant volatility.
5. Fourth Step: Price Patterns and Chart Structures
When candlesticks combine into larger structures, they form price patterns with predictive significance.
- Head and Shoulders Top/Bottom: Classic reversal patterns. Head and shoulders top signals the end of an uptrend; head and shoulders bottom signals the end of a downtrend.
- Double Top/Bottom: Resembles the letters "M" or "W". Double top is a bearish reversal signal; double bottom is a bullish reversal signal.
- Triangles/Flags: Continuation patterns, indicating the market is consolidating energy. Typically, after a breakout, the price continues in its original trend.
Learning Tip: Draw, annotate, and backtest extensively. Find these patterns on historical charts and observe how the price behaved after the pattern formed.
6. Fifth Step: Price-Volume Relationship and Market Confirmation
Price can be deceptive, but volume often reveals true intent. Volume is key to validating the authenticity of any price signal.
Healthy Uptrend: Price rises with increasing volume.
Warning of Trend Exhaustion: Price makes a new high, but volume declines (called "divergence"), indicating weakening buying pressure and a potential trend reversal.
Breakout Confirmation: A breakout above a key resistance level is more credible if accompanied by significantly high volume.
A leading global cryptocurrency platform,suitable for both beginners and experienced traders.
New user benefit: 20% off trading fees upon registration!!
7. Sixth Step: Building Your Own Trading System
After learning various tools, the most crucial step is integrating them into a simple, executable trading system.
A basic system flow is as follows:
Trend Identification: Use MAs or trendlines to determine the current major trend (up or down). Trade only in the direction of the trend.
- Entry Signal: Look for entry points during trend pullbacks, combining candlestick patterns, RSI oversold conditions, or support levels.
- Stop-Loss Setting: Immediately set a stop-loss after entry, typically placed just below a support level or above a resistance level.
- Take-Profit Setting: Set a reasonable target, such as the next resistance level, or use a risk-reward ratio (e.g., aiming for a 2:1 reward-to-risk ratio).
Common Beginner Mistakes: Using too many indicators leading to conflicting signals, or frequently switching strategies. Remember: first use a simple system to achieve "stable, no-loss" trading before pursuing profits.
8. Seventh Step: Continuous Growth and Advanced Resources
Technical analysis is a craft that requires continuous practice and review.
- Keep a Trading Journal: Record the rationale, outcome, and emotions for each trade. Regularly review what you did right and wrong.
- Evaluate Analysis Accuracy: Don't just look at profit/loss; assess whether your technical analysis judgment itself was correct.
- Advanced Learning Paths: After mastering the basics, explore concepts like Fibonacci retracements and Elliott Wave Theory.
Tool Recommendations:
- TradingView: The best charting platform, with a large community sharing ideas and insights.
- CoinGlass: View market liquidation heatmaps and the Fear & Greed Index.
- CryptoQuant: View on-chain data to verify your technical analysis from another dimension.
9. Conclusion: From Reading Charts to Reading Minds
The essence of technical analysis is not a crystal ball for predicting the future, but using the chart as a mirror to understand the collective psychology of thousands of traders behind it. Starting from understanding a single candlestick to grasping a complex pattern, each step enhances your ability to converse with the market.
Practice persistently, be patient, stay humble, and the market will reward you. This beginner's step-by-step guide aims to help you systematically learn how to perform crypto technical analysis. Through continuous practice, recording, and review, you will gradually build your own trading logic and chart language.
Frequently Asked Questions (FAQ)
Q1: What is cryptocurrency technical analysis?
A1: Cryptocurrency technical analysis is a method of studying historical price charts and volume data to identify patterns and trends, attempting to predict future price movements. It focuses primarily on the market's own behavior rather than external information.
Q2: Do I need to know programming or quantitative analysis to learn technical analysis?
A2: Absolutely not. Learning technical analysis is more like learning a new visual language. The key is understanding the logic behind the patterns, trends, and indicators. Modern charting tools (like TradingView) have made all analysis very intuitive.
Q3: Which platform is best for beginners to practice charting?
A3: TradingView is widely considered the best platform for beginners. It has a user-friendly interface, powerful free charting tools, and a vast learning community. You can practice drawing trendlines and using indicators directly in your browser without downloading software.
Q4: Can technical analysis predict prices?
A4: Technical analysis cannot predict prices with 100% accuracy. It provides probability-based decision support. Its value lies in helping you identify high-probability trading opportunities and manage risk. No analytical method is infallible.
Q5: How long does it take to learn technical analysis?
A5: Mastering basic concepts (like candlesticks, support/resistance, basic indicators) might take a few weeks. However, developing your own trading system and applying it consistently usually takes several months or more of continuous practice and review. It's an ongoing evolutionary process.
A leading global cryptocurrency platform,suitable for both beginners and experienced traders.
New user benefit: 20% off trading fees upon registration!!
Further Reading
What is Cryptocurrency Trading? A Beginner's Guide to Buying and Selling Digital Assets
A Beginner's Guide to Cryptocurrency Day Trading
Bitcoin Price History: Evolution from $0 to $100,000
How Do Institutional Investors Influence Crypto Market Price Volatility?
Centralized vs. Decentralized Wallets: Which One is Right for You?
