
How to Use Bitcoin Dominance (BTC Dominance) to Guide Altcoin Trading
Have you ever experienced this situation — your altcoins are plummeting, the community is in despair, but when you open TradingView, Bitcoin's price is still firmly above $60,000, barely moving? At that point, you're probably wondering: whose money is actually being drained?
This question can be explained with one indicator — Bitcoin Dominance (BTC Dominance). It measures Bitcoin's market cap as a percentage of the total cryptocurrency market cap, reflecting the concentration of capital. Simply put: how much of the total crypto market's money is in Bitcoin's hands, and how much is in altcoins. The formula is extremely simple: BTC market cap ÷ total crypto market cap × 100%. When this number rises, it indicates capital is flowing out of altcoins into Bitcoin; when it falls, it indicates capital is moving from Bitcoin to altcoins in search of higher returns.
This article explains this indicator from the ground up: what it is, what the current data looks like, how it has historically signaled altcoin seasons, and how you can use this information now to guide your position decisions. It should be readable even for beginners.
A leading global cryptocurrency platform,suitable for both beginners and experienced traders.
New user benefit: 20% off trading fees upon registration!!
Where Does the Current Dominance Stand? Let's Look at Some Real Data First
Before explaining how to use it, let's see what's happening in the market, so the logic later is easier to understand.
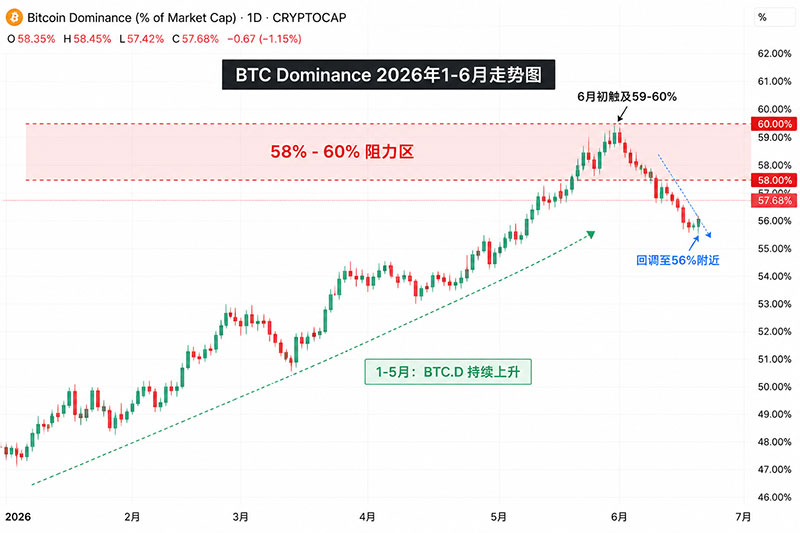
In early June 2026, Bitcoin's price retraced over 50% from its all-time high of $126,000 in October last year, briefly breaking below the $60,000 psychological level. Interestingly, although Bitcoin's price fell, its market dominance actually increased — on June 11, the dominance rate was around 59%, higher than the previous week's low of 57.9%. CoinDesk described this change as a "signal of capital re-entering Bitcoin."
What about altcoins? CoinMarketCap's Altcoin Season Index is currently around 48. How to understand this index? It measures what percentage of the top 100 altcoins have outperformed Bitcoin over the past 90 days — it needs to reach 75 points for an "altcoin season" to be considered started. A score of 48 is still within the "Bitcoin season" category, but interestingly, just about two weeks ago, this index briefly dropped to 17 — meaning only 17 out of 100 altcoins had outperformed Bitcoin at that time. Climbing from 17 to 48 indicates that the most extreme suppression is easing, but a true altcoin season hasn't officially started yet. Renowned analyst Miles Deutscher's view is straightforward: for altcoins to achieve a real "pump," BTC dominance needs to decline continuously. This isn't a matter of a day or two, but the result of a structural rotation of capital.
What is the specific historical fluctuation range for Bitcoin dominance? Theoretically, it can range from 30% to 95%. It was above 90% before 2013, and during the ICO frenzy of 2017-2018, it briefly dropped to 33%. In 2026, it is currently stable between 55% and 60%. Although Bitcoin's absolute value holds half of the market, it no longer has the overwhelming monopoly it had in earlier cycles.
How Does Dominance Explain Altcoin Trading Logic?
Just looking at numbers isn't interesting. Let's translate it into market language. There are four scenarios, and you've probably experienced them all in crypto:
Bitcoin up, Dominance up = Bitcoin Solo Act. Capital is almost exclusively flowing into Bitcoin. Altcoins either can't keep up, trade sideways, or even drop slightly. A classic "party while getting beaten" scenario — suitable for heavy Bitcoin positions and minimizing altcoin holdings.
Bitcoin up, Dominance down = Altcoin Season Window Opens. Bitcoin is rising, but the rate of capital flowing out of BTC exceeds the rate flowing in, indicating capital is dispersing into altcoins seeking higher returns. This is the most favorable combination for altcoins among all four scenarios.
Bitcoin down, Dominance up = Risk-Off Mode, Bitcoin Holds Up Better, Altcoins Suffer More. Many veterans use this method to sense altcoin downturns early, avoiding getting their altcoins cut in half under the deceptive appearance that "Bitcoin isn't dropping much." It's advisable to reduce altcoin positions or switch to USDT during this time.
Bitcoin down, Dominance down = Full-Blown Crash. At this stage, your altcoin positions can't be saved. Survival capital should be in stablecoins or out of the market entirely.
Therefore, to identify the best operational window for altcoins, the key is to watch the process of dominance declining — don't chase after it has already fallen. You should know in advance when it's about to fall and how to allocate during the decline.
Three Confirmation Signals Before a True Altcoin Season Starts
Relying solely on a decline in dominance isn't enough. In a recent report, Nexo provided three essential signals that have historically preceded a major altcoin season triggered by a drop in dominance.
Signal ①: Bitcoin dominance forms a multi-week decline. A one or two-day fluctuation means nothing. A true rotation requires the weekly closing price of dominance to be below approximately 59.6%, followed by a clear multi-week downward trend. As of April 2026, dominance had not yet issued this signal, with the weekly structure still favoring Bitcoin.
Signal ②: ETH/BTC starts to recover. Ethereum has historically been the first destination for capital rotation — if the ETH/BTC price shows sustained stabilization and recovery, it means "smart money" has started moving from Bitcoin to the largest altcoin by market cap. Currently, ETH/BTC is in a downtrend and has not confirmed this signal.
Signal ③: TOTAL3 starts to outperform. TOTAL3 measures the total market cap of all crypto assets excluding Bitcoin and Ethereum. Only when capital truly flows into the small and mid-cap altcoin ecosystem will TOTAL3 show sustained growth. Currently, TOTAL3 is near the lower end of its range, with no clear recovery yet.
As of now, none of these three signals have been confirmed. At the end of April 2026, dominance was around 60.66% and in an uptrend, ETH/BTC was still declining significantly, and TOTAL3 was flat or even shrinking. This means the market has not yet entered a structural rotation, and any localized altcoin rallies are "fragmented and non-systemic."
Practical Position Management: A Few Key Reference Points
Understanding the signals above, the next step is applying them to your own positions. Here are some conservative yet practical principles.
Bitcoin Dominance >60%: Prioritize heavy Bitcoin positions (e.g., 60%-70%+ of portfolio), with altcoins kept below 10%. Keep most capital safe through the risk-off period, and place the remainder in on-chain yield tools for USDT or USDC (a topic we discussed in-depth in our previous article).
Bitcoin rises, and Dominance simultaneously breaks below the 50-55% support zone: Historically, this is a relatively reliable "altcoin season warning." Once this combination appears, it means the rate of capital flowing out of BTC has exceeded the rate of new BTC buying pressure, typically foreshadowing a 3-6 month period where altcoins outperform. At this point, you can reduce Bitcoin positions to 30%-40% and gradually add high-quality altcoins — prioritizing projects with clear narratives (e.g., AI tokens, DePIN, RWA sectors) and strong on-chain activity.
Dominance breaks below 45%: Although this is far from current levels, if it happens, start taking profits on altcoins in batches. Historically, dominance below 45% often indicates the market has entered a peak frenzy phase, with bubbles and risks accumulating.
| Dominance Range | Market Characteristic | Position Strategy |
| >60% | Capital flows back to BTC, altcoins sluggish | BTC 60%-70%, Altcoins <10%, Stablecoins for reserve |
| 55%-60% | Current market, structural stalemate | BTC 50%-60%, small amount of quality altcoins |
| 50%-55% | Capital outflow accelerates, altcoins loosen | Reduce BTC to 40%-50%, position for AI/DePIN/RWA narratives |
| <50% (BTC price still rising) | Key trigger point for altcoin season | BTC 30%-40%, rotate into altcoins |
| <45% | Market frenzy, bubble peak | Take profits on altcoins in batches, return to BTC/USDT |
Disclaimer: Don't Treat This Indicator as a "Silver Bullet"
Many people in the market indeed misinterpret the signals of Bitcoin dominance, and you need to be careful of a few "pitfalls."
Stablecoin market cap distortion. USDT, USDC, and other stablecoins are included in the total market cap, which artificially lowers the calculated value of Bitcoin dominance. Sometimes dominance looks low, but a significant portion of that market cap belongs to "static dollars," not speculative capital dispersing. This is also why, even with capital continuously flowing out of altcoins this year, dominance has still been rising.
Institutionalization has changed the cycle logic. The biggest difference between this cycle and 2017 or 2021 is institutional entry. With the launch of compliant Bitcoin spot ETFs, asset management giants like BlackRock and Fidelity hold Bitcoin as a macro hedge tool for the long term. Capital no longer "immediately flows to altcoins after a rebound" like in the past. The capital flows in spot Bitcoin ETFs and Solana ETFs also prove that emerging stablecoin/RWA assets are diverting some capital, not distributing it evenly as before.
Differentiation is the trend; don't buy junk altcoins. Even if Bitcoin dominance pulls back from 60%, capital won't flow evenly to all altcoins. Among the 2000+ tokens, most will further go to zero or become marginalized. Projects with real activity, revenue, and clear narratives in sectors like AI, DePIN, RWA, and Memecoins on SOL will be the ones to capture the spillover effect of capital.
Finally: Actionable Steps for Beginners
If you don't want to be overwhelmed by market signals, start with these four steps:
1. Download TradingView, add "BTC.D" (Bitcoin Dominance Index) to your watchlist, and set alerts for the key levels of 58% and 60%.
2. Spend a few minutes each week checking the ALT SEASON INDEX — below 25 means absolute Bitcoin dominance, above 75 confirms an altcoin season.
3. Combine the three auxiliary signals — ETH/BTC trend, stablecoin flow changes, and TOTAL3 trend (total market cap excluding BTC+ETH) — you'll be more alert to rotations than the market.
4. Use dominance as a "long-term position adjustment tool," not for gambling on weekly buy/sell points. Combine it with mid-to-long-term indicators like on-chain activity and open interest.
If you're ready to apply this logic to your own position allocation, or want to find mainstream platforms with reliable trading depth, I personally use OKX and Binance. Both have solid depth for BTC spot and futures trading, and new users can get fee discounts:
A leading global cryptocurrency platform,suitable for both beginners and experienced traders.
New user benefit: 20% off trading fees upon registration!!
The world's largest cryptocurrency exchange by trading volume,leading in security and liquidity.
New user benefit: Enjoy 20% off trading fees upon registration!
Investment involves risk. Bitcoin dominance is just a directional reference; it's not a precise buy/sell signal. But it can help you understand where you are — when others are still cluelessly asking "where did the money go," at least you'll have an answer in mind.
FAQ
1. Where can I see the current value of Bitcoin dominance?
Recommended: TradingView (search "BTC.D") for real-time trend observation. CoinMarketCap and CoinGecko also provide BTC.D and the Altcoin Season Index. Also, pay attention to changes in stablecoin supply, e.g., a net outflow of $5-6 billion from stablecoins over the past 30 days is an important auxiliary indicator.
2. Why is the phenomenon of altcoins "falling with Bitcoin but not rising with it" particularly severe in 2026?
The most critical reason is high capital concentration — over the past 13 months, the altcoin market has seen cumulative outflows exceeding $209 billion. Even though Bitcoin's price has retraced over 50% from its $126,000 high, the willingness for capital to return is still very weak, with most risk-off capital returning to Bitcoin rather than altcoins.
3. How exactly is the Altcoin Season Index determined?
It is the percentage of the top 50 or top 100 cryptocurrencies that have outperformed Bitcoin over the past 90 days. An index ≥ 75 (out of 100) means an altcoin season has started, while an index ≤ 25 indicates an absolute Bitcoin season. It is currently around 48, still far from 75.
4. Is it suitable for dollar-cost averaging (DCA) into altcoins at the current stage?
If you don't have much time to watch the charts, it's recommended to choose Bitcoin + leading layer-1 blockchains (ETH/SOL) + leading narrative tokens (RWA/AI related) for small, diversified DCA, and only allocate a very small portion of your total capital. A truly large-scale altcoin rotation might not be confirmed until late 2026 or 2027. DCA now is more about building a position, not gambling on a short-term breakout.
5. Among the four market scenarios, which one is best for selling altcoins and switching to BTC?
The scenario where BTC price is falling + dominance is rising clearly indicates that altcoins will drop much more than Bitcoin. At this point, you should switch altcoins to BTC or sell them into USDT beforehand to avoid getting hit harder later.
6. What is the biggest difference between the 2026 altcoin cycle and the 2021 cycle?
In this cycle, altcoins started from a state of deep discount, with many altcoin valuations already significantly compressed, unlike 2021 which started from highs. The dominant role of institutional capital is stronger, coupled with changes in the short-term macro interest rate environment. The pattern of the altcoin season is likely to evolve into a structural, sector-differentiated rotation, rather than the "universal frenzy" of 2021.
