
What is the NUPL indicator? How to identify market tops and bottoms
Do you want to know whether now is the time to buy the dip or sell the top for Bitcoin? Many crypto veterans will tell you not to just stare at the candlestick charts; on-chain data is where the truth lies. Among the many on-chain indicators, there is one known as the "Market Sentiment Thermometer" — NUPL (Net Unrealized Profit/Loss). It has accurately marked every major market top and bottom zone over the past three bull and bear cycles. This article will start with the principles, combine current real data, and guide you step by step to master the use of NUPL.
A leading global cryptocurrency platform,suitable for both beginners and experienced traders.
New user benefit: 20% off trading fees upon registration!!
1. What is NUPL? What exactly does it measure?
For newcomers just getting into on-chain indicators, thousands of numbers fluctuate in the crypto market every day. Which ones are worth paying attention to? NUPL is one of the most important indicators to understand first.
NUPL stands for Net Unrealized Profit/Loss. Simply put, the question it measures is: On average, are all Bitcoin holders making or losing money right now, and how much are they making or losing?
Why is this important? Because the essence of NUPL is a market sentiment indicator. Its core logic is: compare the price of every Bitcoin at the time of its last movement (i.e., each holder's cost basis) with the current Bitcoin price, calculating the overall profit and loss level of the entire market. The original design of this indicator is to help you see clearly what emotional state the market is in amidst complex price fluctuations, thereby determining whether the market has entered a phase of extreme greed or a phase of panic selling.
2. How is NUPL calculated? What is the principle behind it?
To truly understand NUPL, you first need to grasp two core concepts. Although they sound a bit technical, they are actually quite easy to understand when broken down.
Realized Cap is the value obtained by summing up all Bitcoins, each assigned the price at which it was last moved. In layman's terms, it reflects the "sum of the average purchase cost" of all holders. Every time you buy a Bitcoin, this record updates, leaving your cost footprint. Realized Cap is the sum of all these cost footprints.
Unrealized Profit/Loss is simply the current market cap minus the Realized Cap. If the current total market price is higher than the average purchase cost of all investors, the overall market is in a profitable state; conversely, it is in a loss-making state.
With these two concepts, the formula for NUPL becomes very clear:
NUPL = (Current Market Cap — Realized Cap) ÷ Current Market Cap
From this formula, we can see:
- When NUPL > 0, it indicates the entire market is in a profitable state overall.
- When NUPL < 0, it indicates the entire market is in a loss-making state overall.
- The larger the absolute value of NUPL, the greater the profit or the more severe the loss.
To put it more directly: NUPL is the "profit margin" of the entire market — it aggregates the profit/loss status of millions of holders into a simple, intuitive number.
3. The Five Color Zones of NUPL: Understanding Market Sentiment at a Glance
Analysts usually divide NUPL into five color zones, each corresponding to different market phases and emotional states:
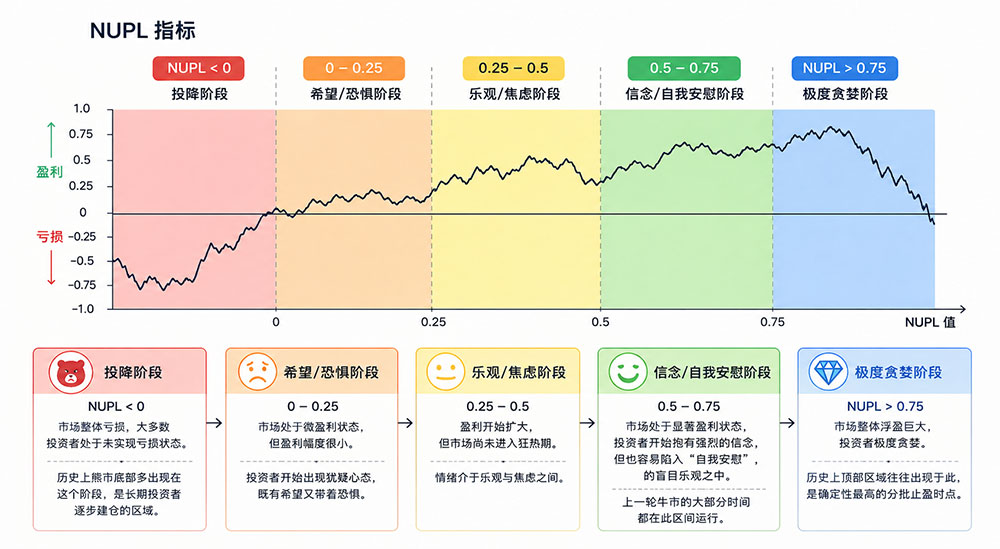
The specific meanings of each zone are as follows:
- Red Zone (NUPL < 0, Capitulation Phase): The overall market is in a loss, with most investors experiencing unrealized losses. Historically, bear market bottoms often appear in this phase, making it an area for long-term investors to gradually build positions.
- Orange Zone (NUPL 0—0.25, Hope/Fear Phase): The market is in a slight profit state, but the profit margin is very small. Investors begin to show hesitation, feeling both hope and fear.
- Yellow Zone (NUPL 0.25—0.5, Optimism/Anxiety Phase): Profits begin to expand, but the market hasn't entered a frenzy yet. Sentiment is between optimism and anxiety.
- Green Zone (NUPL 0.5—0.75, Belief/Complacency Phase): The market is in a significant profit state. Investors start to hold strong beliefs but are also prone to falling into the blind optimism of "complacency." Most of the last bull market operated within this zone.
- Blue Zone (NUPL > 0.75, Extreme Greed Phase): The overall market has huge unrealized gains, and investors are extremely greedy. Historically, top areas often appear here, making it the highest-conviction time for phased profit-taking.
It's important to note that NUPL cannot precisely tell you "tomorrow is the top" like an alarm clock. Historical data shows it is very accurate in indicating bottom zones, but relatively broad in indicating tops. The top of the 2017 bull market briefly touched the blue zone, while the 2021 bull market never reached the blue zone, operating entirely within the green zone throughout the cycle. Therefore, when judging tops, NUPL is best used in conjunction with other indicators, rather than relied upon alone.
4. How to Use NUPL to Identify Tops?
For identifying tops, the core idea of using NUPL is to observe the phenomenon of NUPL turning downward from a high level — this is often a signal of increasing profit-taking pressure.
When NUPL exceeds 0.5 or even surges above 0.75, it indicates that the scale of unrealized profits in the market is at a historical high, and every holder has accumulated a large amount of paper profits. At this point, once there is any slight disturbance in the market environment (e.g., macroeconomic headwinds, policy changes), profit-takers may choose to cash out at any time, leading to market corrections.
Several signals can be referenced when using NUPL to identify tops:
1. NUPL operates at a high level (above 0.5) for more than 3 months, lacking further upward momentum.
2. NUPL turns downward from its peak, accompanied by price consolidation or a decline — this indicates that although the price hasn't dropped much, the overall market profit is shrinking, signaling that profit-taking is occurring.
3. Divergence between long-term and short-term NUPL: If the overall NUPL is still high, but the NUPL of short-term holders has weakened first, it suggests that "retail investors" are starting to lose money, and the rally may be nearing its end.
A leading global cryptocurrency platform,suitable for both beginners and experienced traders.
New user benefit: 20% off trading fees upon registration!!
5. How to Use NUPL to Identify Bottoms?
Compared to identifying tops, NUPL is much more accurate in identifying bottoms. Historically, every major bottom has seen NUPL fall into the red zone (NUPL < 0) without exception.
Let's review the characteristics of past bottoms:
- 2018 Bottom: NUPL touched negative territory.
- March 2020 Crash (312): NUPL also fell into negative territory.
- 2022 Bear Market Bottom: NUPL was below 0 for most of the second half of 2022.
- Mid-2025 Bull Market: NUPL remained above the 0.5 green zone for a long time, rising alongside the price.
Thought process for using NUPL to identify bottoms:
- When NUPL continuously declines from a high level and gradually approaches 0, start paying close attention to market changes rather than rushing to act.
- When NUPL officially breaks below 0 into the red zone, strategies like phased Dollar-Cost Averaging (DCA) or ladder-style position building often have a high historical success rate. In the past three bottoms, NUPL accurately touched the same support area.
- When NUPL recovers from negative territory back above 0 (orange zone), it is usually the first confirmation signal of a bear-to-bull transition and one of the final "golden buying windows."
Advanced Tip: There is a sub-indicator called LTH-NUPL (Long-Term Holder Net Unrealized Profit/Loss), which specifically measures the overall profitability of holders who have held coins for more than 155 days. When LTH-NUPL falls into negative territory, it means even long-term holders are starting to lose money, which historically corresponds to almost every bear market's lowest point. However, it's worth noting that with increasing institutional capital inflows, whether LTH-NUPL will maintain the same precise performance in the future remains uncertain.
6. Current Market (April 2026) NUPL Situation
After understanding the principles, let's look at where the current market stands. According to the latest report released by Fidelity Digital Assets in April 2026, the NUPL situation for several mainstream coins is as follows:
| Coin | Current NUPL Value | Market Phase | Year-to-Date Performance (2026) |
| Bitcoin (BTC) | Approx. 0.21—0.30 | Hope/Fear (Orange Zone) | Down approx. 25% |
| Ethereum (ETH) | Approx. 0.046 / -0.053 | Neutral to Negative | Down approx. 31% |
| Solana (SOL) | Approx. -0.67 | Capitulation (Red Zone) | Down approx. 38% |
There are several noteworthy points in this data:
Bitcoin's current NUPL is between 0.21 and 0.30, placing it in the orange "Hope/Fear" zone. This means that although most investors still have paper profits overall, the profit margin is already very limited (according to Fidelity's report calculations, the average is only about 21%). In the first quarter of 2026, Bitcoin fluctuated mostly in the $62,500 to $76,022 range, experiencing a significant price pullback. The decline in NUPL also reflects that most of the unrealized profits accumulated during the 2025 bull market have been erased.
It is worth noting that NUPL has already fallen significantly from its highs, briefly approaching a reading of 0.229 in March 2026, not far from levels that historically marked bottoms. Some analysts also believe that the current NUPL is still in the middle of the "Hope" zone, some distance away from the true bottom capitulation zone.
Ethereum's NUPL is around 0.046 (some platforms show -0.053), very close to the breakeven point. This position reflects a price of approximately $2,100, and the market has entered a temporary state of equilibrium.
Solana's NUPL has dropped to -0.67, entering the red zone, indicating that the majority of SOL holders are in an average loss-making state. Although there is uncertainty during the decline, a deeper deviation also suggests it is closer to a value zone.
The above data is as of late April 2026, sourced from Fidelity Digital Assets' quarterly report, CoinGlass, and multiple authoritative crypto news platforms. The cryptocurrency market is highly volatile, and related data changes constantly. Please refer to real-time market conditions.
7. Cross-Validation Combining NUPL with Other Indicators
Relying on just one indicator is dangerous. Although NUPL is powerful, it describes the "average profit level." If you only look at the overall average, you might miss important local signals. Therefore, cross-validation is very important.
The following three indicators are suitable for use with NUPL:
- MVRV Z-Score: Measures the standard deviation deviation of the current market cap relative to the realized cap, helping to determine if the market is in an extremely overvalued or undervalued state. The MVRV Z-Score is currently around -2.28, having broken below the bottom levels of the previous two bear markets.
- Short-Term Holder NUPL (STH-NUPL): Similar to regular NUPL, but only counts the profit/loss status of addresses holding coins for less than 155 days. STH-NUPL breaking below 0 into negative territory is an important leading signal for judging short-term market bottoms.
- Rainbow Chart: Renders Bitcoin prices in rainbow colors across different zones, providing a very intuitive way to see the valuation range of the current price. It's a user-friendly reference tool for long-term DCA.
The usual recommendation is: NUPL provides a macro perspective of the overall market profit/loss, STH-NUPL tracks changes in short-term investor sentiment, and MVRV Z-Score offers a quantitative judgment from a valuation perspective. When the three indicators align in direction, the reliability of the signal increases significantly.
8. Several Blind Spots and Misconceptions You Must Know When Using NUPL
NUPL is an undeniable "on-chain psychology tool," but it also has several natural blind spots:
It cannot provide precise "point-in-time" predictions. After NUPL falls below zero, the market may remain in the bottom zone for several more months before starting a new uptrend. For short-term speculators, its signal lag might be less friendly.
The composition of Bitcoin participants is changing. With the approval of spot Bitcoin ETFs and increasing institutional capital inflows, the participant base of the crypto market has evolved from being dominated by early retail investors to a complex mix of deep institutional involvement. This change in participant structure may require recalibrating the "standard thresholds" of NUPL from past cycles in the future — for example, future bull market tops may not necessarily touch the blue zone of 0.75; future bottoms may not necessarily see a significant drop below 0 before rebounding.
NUPL cannot handle "Black Swan" events alone. If extreme uncontrollable events erupt in the market, the bottom zone indicators given by NUPL could be briefly breached in panic, and the reversal time could be delayed. NUPL is an excellent auxiliary decision-making tool, but using it as the sole sacred trigger for buying dips and selling tops still carries significant risk.
A leading global cryptocurrency platform,suitable for both beginners and experienced traders.
New user benefit: 20% off trading fees upon registration!!
